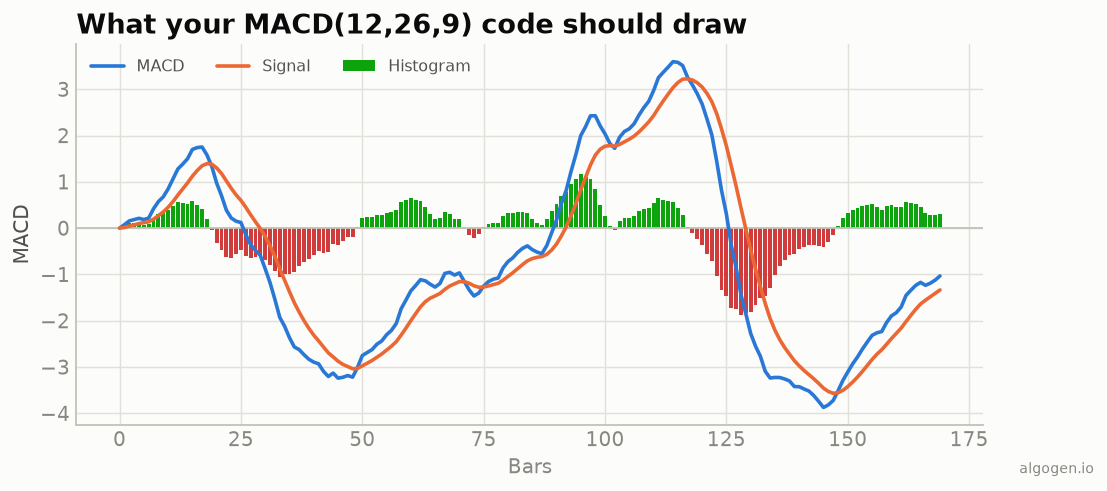
EasyLanguage has had the MACD baked in for decades, which makes sense — Appel’s indicator and TradeStation’s systematic-trading heritage grew up together. Here’s the MACD from the explainer as a clean study, plus the strategy version that actually tests it.
What you’ll need
- TradeStation or MultiCharts
- The EasyLanguage / PowerLanguage Editor, new Indicator
The source
EasyLanguage’s MACD( Price, FastLen, SlowLen ) reserved word returns the MACD
line directly. The signal is an XAverage (exponential average) of that line,
and the histogram is the difference:
{ AlgoGen MACD — TradeStation / MultiCharts }
inputs:
    FastLen( 12 ),
    SlowLen( 26 ),
    SignalLen( 9 );

variables:
    MacdLine( 0 ),
    SignalLine( 0 ),
    Hist( 0 );

MacdLine    = MACD( Close, FastLen, SlowLen );
SignalLine  = XAverage( MacdLine, SignalLen );
Hist        = MacdLine - SignalLine;

Plot1( Hist, "Histogram" );
Plot2( MacdLine, "MACD" );
Plot3( SignalLine, "Signal" );
Plot4( 0, "Zero" );

{ Colour the histogram by sign }
if Hist >= 0 then
    SetPlotColor( 1, Green )
else
    SetPlotColor( 1, Red );
XAverage is EasyLanguage’s exponential moving average, so
XAverage( MacdLine, 9 ) is precisely the 9-period signal line. Apply this in a
sub-graph and you get the blue/orange lines with the green/red histogram from the
output chart.
The strategy version
To actually test the classic MACD cross — the whole point of EasyLanguage:
{ AlgoGen MACD Cross — Strategy }
inputs: FastLen( 12 ), SlowLen( 26 ), SignalLen( 9 );
variables: MacdLine( 0 ), SignalLine( 0 );

MacdLine   = MACD( Close, FastLen, SlowLen );
SignalLine = XAverage( MacdLine, SignalLen );

if MacdLine crosses over SignalLine then
    Buy next bar at market
else if MacdLine crosses under SignalLine then
    Sell next bar at market;
Run the Strategy Performance Report and let the numbers judge the rule, not your hopes.
Gotchas
MACD()returns only the line. The signal and histogram are yours to build withXAverageand subtraction — a common point of confusion for people expecting all three from the reserved word.XAverage, notAverage. The signal line is exponential (XAverage). Using the simpleAveragehere would give you a non-standard MACD.next bar at marketavoids assuming you filled at the signal price itself.
Same indicator elsewhere: Python, MQL5, Pine Script, NinjaScript. Then backtest it in AlgoGen.
This post is educational, not financial advice. Indicators describe the past; they don’t predict the future. Backtest anything before you risk real money on it.
Sources and further reading
- Gerald Appel (CMT Association)
- What is EasyLanguage? (TradeStation)