EasyLanguage gives you Bollinger Bands two ways: a dedicated BollingerBand
function and the more explicit Average + StandardDev combo. We’ll use both,
and wire up a squeeze alert. See the explainer
for the concept.
What you’ll need
- TradeStation or MultiCharts
- The EasyLanguage / PowerLanguage Editor, new Indicator
The explicit version
Building it from Average and StandardDev makes the population-vs-sample choice
visible — and it’s the choice that matters:
{ AlgoGen Bollinger Bands — TradeStation / MultiCharts }
inputs:
    Price( Close ),
    Length( 20 ),
    NumDevs( 2.0 );

variables:
    MidLine( 0 ),
    SD( 0 ),
    UpBand( 0 ),
    LoBand( 0 );

MidLine = Average( Price, Length );
SD      = StandardDev( Price, Length, 1 );   { 1 = population std (divide by N) }

UpBand = MidLine + NumDevs * SD;
LoBand = MidLine - NumDevs * SD;

Plot1( MidLine, "Middle" );
Plot2( UpBand,  "Upper" );
Plot3( LoBand,  "Lower" );
The third argument to StandardDev is the data type: 1 selects the population
standard deviation (divide by N), which is what Bollinger Bands require. Passing
2 would give the sample version and make your bands too wide — the EasyLanguage
form of the ddof bug.
The squeeze alert
{ Add to the study above }
variables: BandWidth( 0 );
BandWidth = ( UpBand - LoBand ) / MidLine;

if BandWidth <= Lowest( BandWidth, 100 ) then
    Alert( "Bollinger squeeze — low volatility" );
The shortcut
TradeStation also ships a BollingerBand( Price, Length, NumDevs ) function that
returns a band directly (call it with +NumDevs for the upper and -NumDevs for
the lower). Handy, but the explicit version above is clearer about the std-dev
setting.
A squeeze-breakout strategy
The whole reason to be in EasyLanguage is to test rules, so here’s the squeeze breakout as a Strategy:
{ AlgoGen BB Squeeze Breakout — Strategy }
inputs: Length( 20 ), NumDevs( 2.0 ), Lookback( 100 );
variables: Mid( 0 ), SD( 0 ), UpB( 0 ), LoB( 0 ), BW( 0 );

Mid = Average( Close, Length );
SD  = StandardDev( Close, Length, 1 );
UpB = Mid + NumDevs * SD;
LoB = Mid - NumDevs * SD;
BW  = ( UpB - LoB ) / Mid;

{ Was the prior bar in a squeeze, and did we break out this bar? }
if BW[1] <= Lowest( BW, Lookback )[1] then begin
    if Close > UpB then Buy next bar at market;
    if Close < LoB then SellShort next bar at market;
end;
Run the Strategy Performance Report to see whether the squeeze breakout actually had an edge on your instrument — the numbers, not the pretty channel, decide.
Verify & apply
- Paste, press F3 to verify, apply on the price sub-graph (overlay).
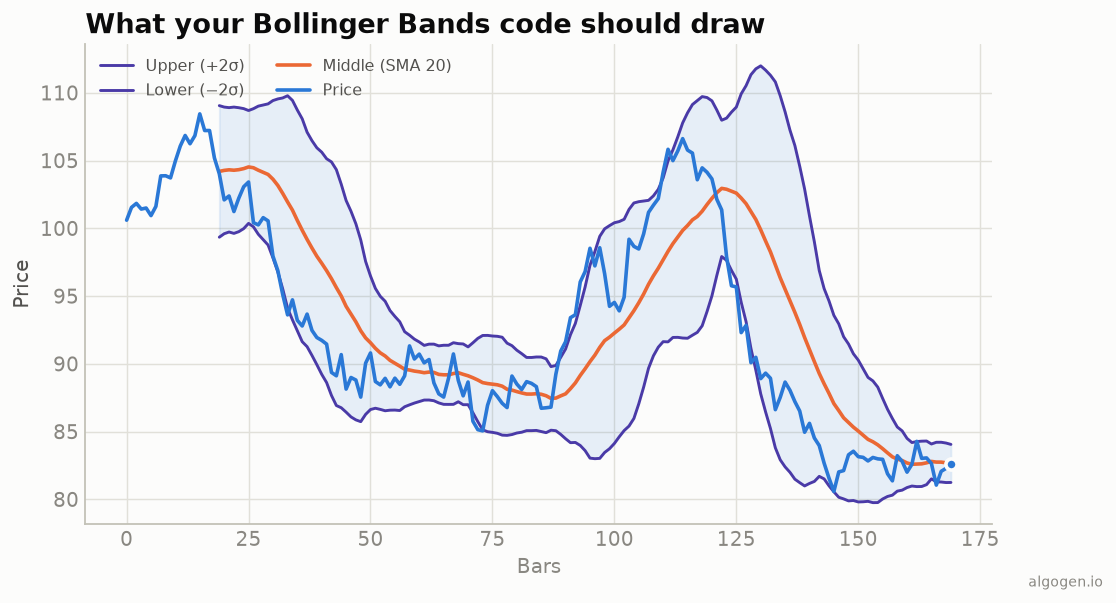
- Confirm your bands line up with the output chart — same width, same breathing.
Gotchas
StandardDev(..., 1)for population. The most important line in the file.MaxBarsBack≥ Length so the deviation has a full window.
Same indicator elsewhere: Python, MQL5, Pine Script, NinjaScript. Then backtest it in AlgoGen.
This post is educational, not financial advice. Indicators describe the past; they don’t predict the future. Backtest anything before you risk real money on it.
Sources and further reading
- John Bollinger's official Bollinger Bands reference (Bollinger Capital Management)
- What is EasyLanguage? (TradeStation)