Almost every indicator in this series was built to save effort — a formula a computer could crunch in an instant. Ichimoku Kinko Hyo is the glorious exception. It was built by hand, over decades, by a Japanese newspaperman and teams of assistants doing arithmetic with pencils, long before a computer was anywhere near a trading desk. Knowing that changes how you see those five lines.
The man behind the mountain name
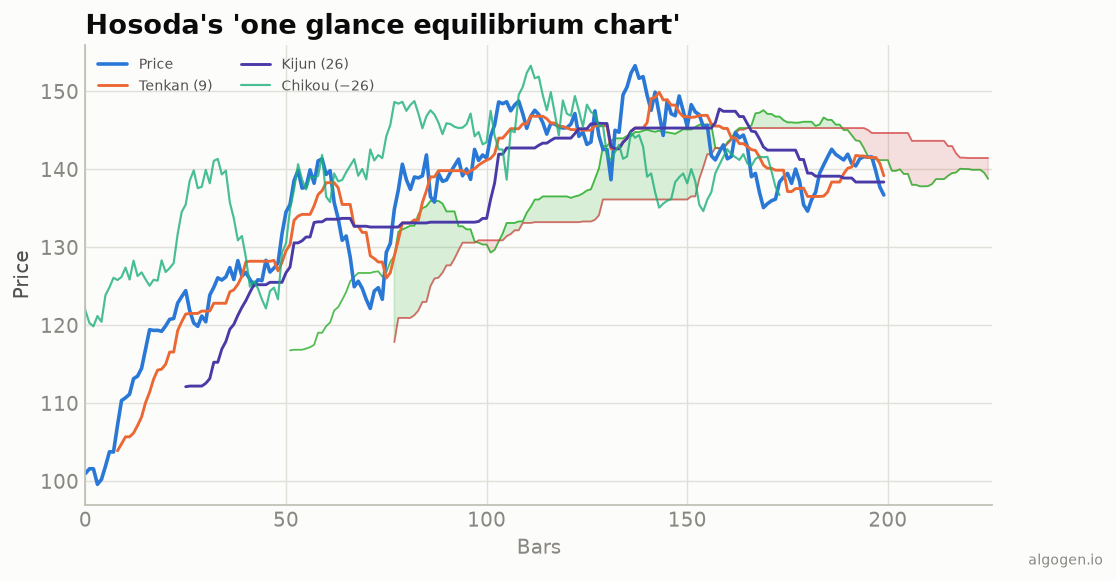
Ichimoku was the life’s work of Goichi Hosoda (born 1898), a Japanese journalist who served as the head of the commercial/markets department at the newspaper Miyako Shimbun (a forerunner of today’s Tokyo Shimbun). He wrote about markets under the pen name Ichimoku Sanjin — a name that evokes “a man standing back on a mountain, seeing everything at a glance.” That idea, seeing the whole situation in one look, became the soul of the system and is baked into its name: Ichimoku Kinko Hyo translates to something like “one glance equilibrium chart” or “at-a-glance balanced bar chart.”
Decades of pencils and students
Here’s the part that’s hard to imagine in the software era. Starting in the 1930s, Hosoda set out to build a charting method that could summarize a market’s state instantly. To do it, he reportedly employed teams of students and assistants — young people (often called his “kids”) who spent years manually calculating candidate formulas and back-testing them across mountains of price data, all by hand. He tried countless combinations, tuning the periods and the displacements, keeping what worked and discarding what didn’t.
This was brute-force research decades before the tools that make it easy. Where a modern quant runs a parameter sweep in seconds, Hosoda’s team ground through it with paper and patience. That’s why the settings feel so deliberate: 9, 26, and 52 weren’t guesses — they emerged from years of manual testing against the six-day trading week of the era, where 26 approximated a month and 52 two months.
Kept quiet, then published
Hosoda developed the method largely in private, reportedly not revealing it fully even as he refined it, sharing it with a circle of associates around the 1950s before finally committing the complete system to print. The first volume of his work was published in 1969, eventually running to a multi-volume set that laid out the full theory. It became widely followed in Japan, where Ichimoku is a mainstream, deeply respected method — far from the exotic curiosity it can seem like to newcomers elsewhere.
The long trip west
For decades Ichimoku stayed largely within Japan, partly because the definitive material was in Japanese and the system’s depth resisted a quick summary. It began reaching Western traders more seriously from around the 1990s, as translations, dedicated writers, and charting software brought the five lines and the cloud to a global audience. Today every major platform ships Ichimoku, cloud and all, and its once-alien vocabulary — Tenkan, Kijun, Kumo, Chikou — has entered the standard technical-analysis lexicon.
Why it endured
Ichimoku survived the journey from pencils to pixels for a reason that’s almost poetic: it was designed from the start to be read at a glance, and that goal made it genuinely useful once the tedious calculation was handed to computers. Hosoda did the hardest possible version of the work — building and validating a multi-component system entirely by hand — precisely so that the user wouldn’t have to think hard. That’s a rare kind of generosity in indicator design.
There’s a nice irony worth sitting with. Hosoda’s whole aim was equilibrium — the “kinko” in the name — the idea that price is constantly seeking balance and that the cloud maps where that balance lies. He pursued that elegant, holistic concept through the least elegant means imaginable: years of grinding manual computation. The beauty of the output was paid for by the tedium of the process.
And, fittingly for this series, the payoff is that the arithmetic is now trivial: five midpoints of high-low ranges and a couple of time shifts. The decades of manual labor produced a system you can rebuild in a few lines of code, which is exactly what we do in the implementation posts.
This post is educational, not financial advice. Indicators describe the past; they don’t predict the future. Backtest anything before you risk real money on it.
Sources and further reading
- Ichimoku: At a Glance (CMT Association)