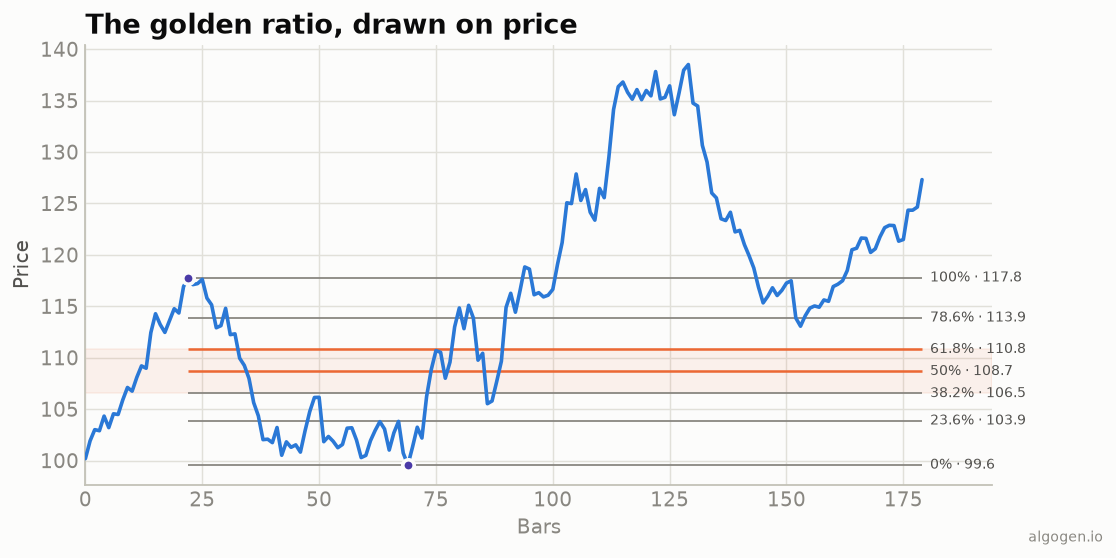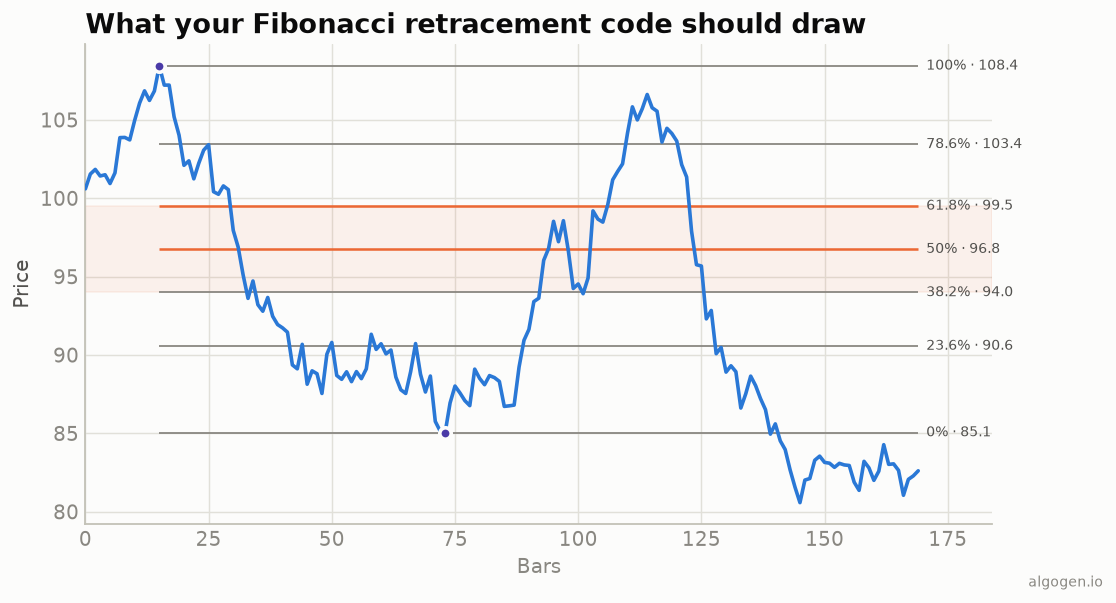
TradingView has a manual Fibonacci tool, but scripting it lets you auto-draw levels from a rule-based swing — which is the honest, testable way to use them (see the explainer).
What you’ll need
- A TradingView account (free tier is fine)
- The Pine Editor
The source
//@version=5
indicator("AlgoGen Fibonacci", shorttitle="AG Fib", overlay=true)

lookback = input.int(90, "Swing lookback")

swingHigh = ta.highest(high, lookback)
swingLow  = ta.lowest(low, lookback)
diff = swingHigh - swingLow

levels = array.from(0.0, 0.236, 0.382, 0.5, 0.618, 0.786, 1.0)
var line[]  lines  = array.new_line()
var label[] labels = array.new_label()

// Clear and redraw on the last bar only (keeps it clean).
if barstate.islast
    for i = 0 to array.size(lines) - 1
        line.delete(array.get(lines, i))
        label.delete(array.get(labels, i))
    array.clear(lines)
    array.clear(labels)
    for i = 0 to array.size(levels) - 1
        r = array.get(levels, i)
        y = swingLow + r * diff
        ln = line.new(bar_index - lookback, y, bar_index, y,
                      color = (r == 0.618 or r == 0.5) ? color.orange : color.gray)
        array.push(lines, ln)
        array.push(labels, label.new(bar_index, y,
                   str.tostring(r * 100, "#.#") + "%", style=label.style_none,
                   textcolor=color.gray))
ta.highest/ta.lowest pick the swing by rule; each level is swingLow + r × diff; and we draw them with line.new on the last bar, emphasizing the 50% and
61.8% lines — matching the output chart.
Highlighting the golden zone
The 38.2–61.8% “golden zone” is where pullbacks most often reverse, so shading it and alerting when price enters is genuinely useful:
goldenLow  = swingLow + 0.382 * diff
goldenHigh = swingLow + 0.618 * diff
inZone = close >= goldenLow and close <= goldenHigh
bgcolor(inZone ? color.new(color.orange, 90) : na, title="Golden zone")
alertcondition(inZone and not inZone[1], "Entered golden zone", "Price entered the 38.2-61.8% zone")
Now the pane tints when price trades back into the golden zone — the moment a Fibonacci trader watches for a continuation entry, and something you can actually alert on and test.
Gotchas
- Draw on
barstate.islast. Recreating lines every bar is wasteful and messy; redraw once on the final bar and clean up the old objects first. - Object limits. Pine caps the number of lines/labels; delete before redrawing so you don’t hit the ceiling.
- Swing direction. This measures up from the lowest low; for retracing an up-move, flip the anchors. Whichever you choose, keep it a rule, not a guess.
Same indicator elsewhere: Python, MQL5, EasyLanguage, NinjaScript. Then test the levels in AlgoGen.
This post is educational, not financial advice. Indicators describe the past; they don’t predict the future. Backtest anything before you risk real money on it.
Sources and further reading
- Pine Script built-ins (TradingView)