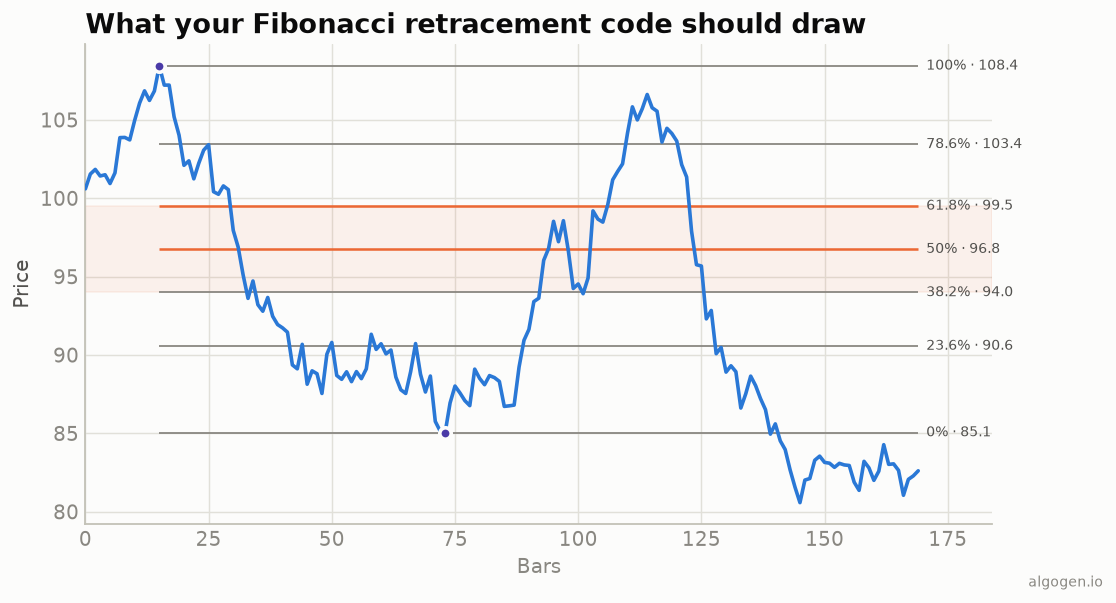
EasyLanguage doesn’t have a scripted “fib tool,” but computing the levels from a rule-based swing and plotting them as horizontal lines is straightforward — and more testable than eyeballing. See the explainer for the concept.
What you’ll need
- TradeStation or MultiCharts
- The EasyLanguage / PowerLanguage Editor, new Indicator
The source
{ AlgoGen Fibonacci Retracement — TradeStation / MultiCharts }
inputs:
    Lookback( 90 );

variables:
    SwingHigh( 0 ), SwingLow( 0 ), Diff( 0 );

SwingHigh = Highest( High, Lookback );
SwingLow  = Lowest( Low, Lookback );
Diff = SwingHigh - SwingLow;

{ Each plotted line is a retracement level measured up from the low }
Plot1( SwingLow + 0.000 * Diff, "0%" );
Plot2( SwingLow + 0.236 * Diff, "23.6%" );
Plot3( SwingLow + 0.382 * Diff, "38.2%" );
Plot4( SwingLow + 0.500 * Diff, "50%" );
Plot5( SwingLow + 0.618 * Diff, "61.8%" );
Plot6( SwingLow + 0.786 * Diff, "78.6%" );
Plot7( SwingLow + 1.000 * Diff, "100%" );
Highest/Lowest pick the swing by rule, and each plot is SwingLow + ratio × Diff — the same arithmetic as everywhere else, rendered as horizontal lines that
step as the swing updates, matching the output chart.
Testing whether a level holds
variables: GoldenLow( 0 ), GoldenHigh( 0 );
GoldenLow  = SwingLow + 0.382 * Diff;
GoldenHigh = SwingLow + 0.618 * Diff;

if Close >= GoldenLow and Close <= GoldenHigh then
    Alert( "Price in the Fibonacci golden zone" );
Adding extension targets
Beyond the retracement, Fibonacci extensions project targets past the 100% level — handy for exits. Add them with the same arithmetic:
Plot8( SwingLow + 1.272 * Diff, "127.2%" );
Plot9( SwingLow + 1.618 * Diff, "161.8%" );
161.8% is the golden ratio projected beyond the swing — a common profit target
once a retracement holds and the trend resumes.
Gotchas
- The swing is a rule here. Using
Highest/Lowestover a lookback keeps it objective; that’s what makes it backtestable rather than hindsight-fit. - Lines will “walk.” Because the swing updates each bar, the plotted levels shift when a new high or low forms — expected behavior for an auto-fib, but different from a hand-drawn, fixed fib.
- 50% isn’t Fibonacci — it’s included by convention (Dow Theory).
Same indicator elsewhere: Python, MQL5, Pine Script, NinjaScript. Then backtest it in AlgoGen.
This post is educational, not financial advice. Indicators describe the past; they don’t predict the future. Backtest anything before you risk real money on it.
Sources and further reading
- What is EasyLanguage? (TradeStation)