By now, if you’ve been reading this series, one name keeps recurring like a drumbeat: J. Welles Wilder Jr. The RSI came from him. So did ATR and the Parabolic SAR. And so did the Average Directional Index — arguably the most sophisticated tool in his remarkable 1978 book, and the one that best captures how he thought about markets.
The book that keeps giving
The ADX arrived, like Wilder’s other inventions, in New Concepts in Technical Trading Systems (1978). It wasn’t a standalone indicator so much as the capstone of a whole method Wilder called the Directional Movement System. The system’s components — +DM, −DM, +DI, −DI, DX, and finally ADX — build on one another in layers, which is why ADX feels more elaborate than his other tools. It was the work of an engineer thinking systematically: define directional movement precisely, normalize it for volatility, then distill it into a single measure of trend strength.
The problem he was solving
Wilder understood something that a lot of traders learn the hard way: the same tool that prints money in a trend bleeds money in a range. A moving-average crossover system is glorious in a strong trend and a disaster in a choppy market, where it whipsaws you on every fake-out. What traders needed wasn’t just a signal — it was a way to know when the environment favored trend-following at all.
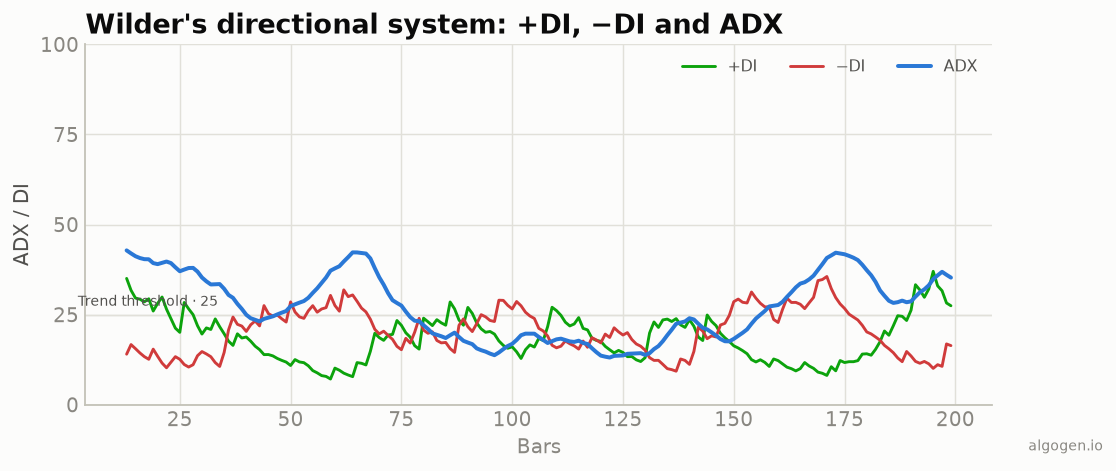
That’s the gap the ADX fills. By measuring trend strength separately from direction, it lets a trader ask two independent questions: “Is there a trend worth trading?” (ADX level) and “Which way?” (+DI vs −DI). This separation was a genuinely important conceptual step. It reframed indicators from pure signal generators into regime detectors — tools that tell you which other tools to trust right now.
The volatility-normalization trick
One elegant detail worth appreciating: the directional indicators divide directional movement by the Average True Range. That’s not incidental — it’s the same ATR Wilder introduced in the very same book, reused here to normalize directional movement so the DI values are comparable across instruments and volatility regimes. Wilder’s tools were designed as a system, with pieces that plug into each other, which is part of why they’ve aged so well.
ADXR and the rest of the system
Wilder didn’t stop at ADX. In the same book he defined ADXR (the Average Directional Movement Rating), a smoothed average of the current ADX and the ADX from a number of bars ago, meant to give an even steadier read of trend strength for ranking markets. The broader Directional Movement System also fed into his Commodity Selection Index, which used ADXR and volatility to rank which markets were most worth trading at a given time. In other words, ADX wasn’t conceived as an isolated squiggle — it was one gear in a machine for deciding where to deploy capital. That systems-thinking is a big reason Wilder’s work has aged so gracefully.
The familiar “ADX above 25 means trending” heuristic is a later convention rather than a hard rule from Wilder himself; different traders use 20, 25, or even 30 depending on the market and timeframe. Like the RSI’s 70/30 or the MACD’s 12/26/9, it’s a widely-shared default with enough people watching it to carry some self-fulfilling weight.
Why it endured
The ADX is, frankly, more complicated than most of Wilder’s other work, and it lags noticeably because of its double smoothing. Yet it survived and thrived, because the idea underneath it is timeless and genuinely useful: measure whether a trend exists before you bet on one. Trend-followers use ADX as a filter; range-traders use a low ADX as their green light; system builders use it to switch between strategies. When charting software spread, the whole Directional Movement System came along, and ADX became a standard study everywhere.
Like the rest of Wilder’s 1978 toolkit, none of it is proprietary — it’s a chain of well-specified arithmetic you can reproduce exactly. The math is more involved than an RSI, but it’s still just addition, division, and Wilder’s smoothing, which is precisely what we build in the implementation posts.
This post is educational, not financial advice. Indicators describe the past; they don’t predict the future. Backtest anything before you risk real money on it.