If you’ve read the RSI history, the origin of the Average True Range will sound familiar: it comes from the same person, the same year, and the same remarkable book. J. Welles Wilder Jr. introduced the ATR in his 1978 classic, New Concepts in Technical Trading Systems — the volume that also gave the world the RSI, the ADX, and the Parabolic SAR. But the ATR solves a very specific problem that says a lot about the markets Wilder actually traded.
The problem: commodities gap
Wilder was primarily a commodities man, and commodity futures in the 1970s had a feature that made naive volatility measures misleading: limit moves and gaps. A futures contract could close at one price and then, on the next session, gap sharply — sometimes locking “limit up” or “limit down” and barely trading in between. If you measured a day’s volatility as simply high minus low, a day that gapped violently but then traded in a narrow range would look calm, when in fact a huge move had occurred between the close and the next bar.
That’s a dangerous blind spot. A volatility measure that underestimates risk exactly on the days risk is highest is worse than useless.
The fix: True Range
Wilder’s solution was True Range, which measures a bar’s movement as the greatest of three distances: the current high-to-low, the distance from the previous close up to the current high, and the distance from the previous close down to the current low. By anchoring to the previous close, True Range captures the full extent of a move even when price gaps — the gap itself becomes part of the measured range. It’s a small, elegant correction that makes the number honest on exactly the days that matter most.
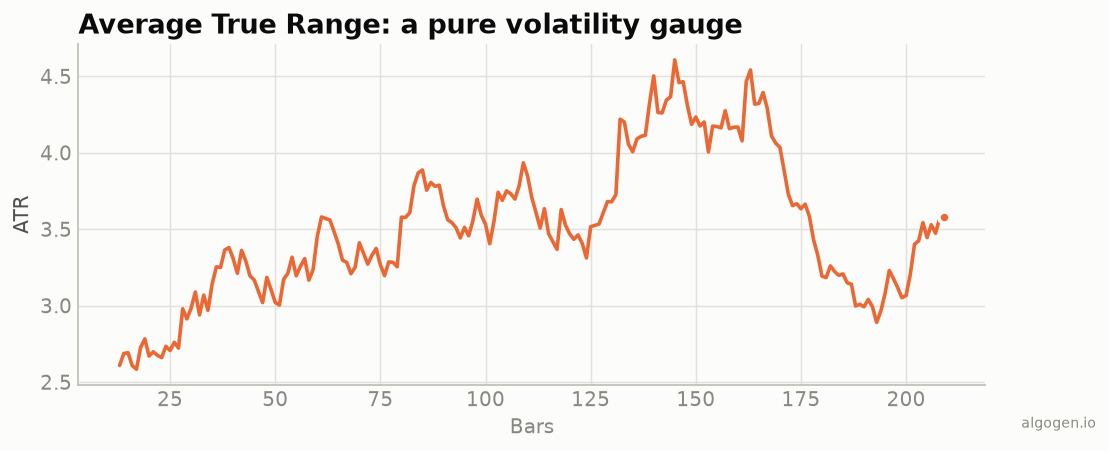
The Average True Range then applies Wilder’s signature smoothing — the same
1/N running average he used throughout the book — to turn the jumpy bar-by-bar
True Range into a stable volatility reading. The default period, as with his other
indicators, is 14.
Why it mattered more than it looked
At first glance ATR is the least exciting indicator in Wilder’s book — it doesn’t generate buy or sell signals, it just measures wiggle. But it turned out to be one of the most durable and reused ideas in all of technical analysis, because volatility measurement is the foundation of risk management. You can’t size a position sensibly or place a stop intelligently without a volatility estimate, and ATR gave traders a simple, robust one.
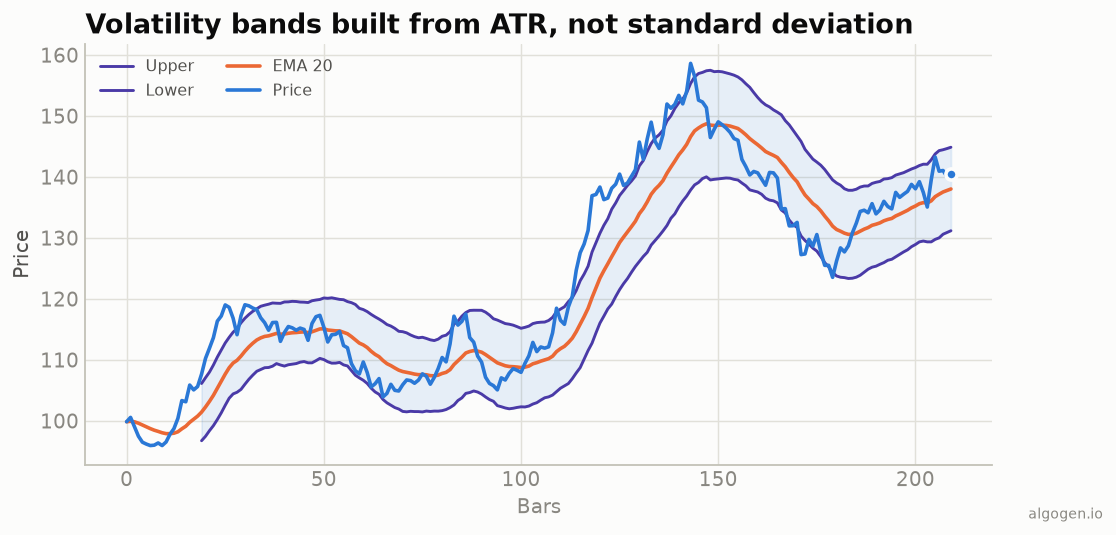
Decades later, ATR sits at the heart of techniques Wilder never named: the Chandelier Exit, Keltner Channels (which use ATR for their band width — see the Keltner post), the SuperTrend indicator, volatility-based position sizing used by professional trend-followers, and countless “ATR stop” variations. The famous Turtle Traders sized their positions using a volatility unit (“N”) that was essentially ATR. An indicator that generates no signals of its own ended up quietly underpinning the risk engines of serious systematic trading.
A whole family of stops grew from it
The clearest sign of ATR’s influence is how many risk techniques are just “ATR with a rule attached.” Chuck LeBeau’s Chandelier Exit trails a stop a few ATRs below the highest high since entry. The popular SuperTrend indicator (a later cluster in this series) plots bands at a multiple of ATR around price. “ATR trailing stops,” “volatility stops,” and “N-based sizing” are all the same core idea: let the market’s own measured volatility set your distances, instead of a fixed number you picked out of the air. That’s a genuinely important shift in thinking — from “I’ll risk 20 points” to “I’ll risk an amount scaled to how much this market is actually moving right now” — and ATR is the number that makes it possible.
The pattern, again
Like the rest of Wilder’s toolkit, the ATR spread because it was simple, well-specified, and trivial to compute — a natural fit for the charting software that arrived soon after. And like everything in this series, nobody owns it: True Range is three subtractions and a max, ATR is a running average of that. You can build the exact tool Wilder published in 1978 this afternoon, which is what we do in the implementation posts.
This post is educational, not financial advice. Indicators describe the past; they don’t predict the future. Backtest anything before you risk real money on it.
Sources and further reading
- New Concepts in Technical Trading Systems (Windsor Books)