You know the drill by now: another indicator, another appearance by J. Welles Wilder Jr. and his extraordinary 1978 book. But the Parabolic SAR stands out even among Wilder’s inventions, because it wasn’t really designed to be an entry signal at all. It was designed to solve a problem most indicators ignore entirely: when and where do you get out?
Born in the 1978 book — again
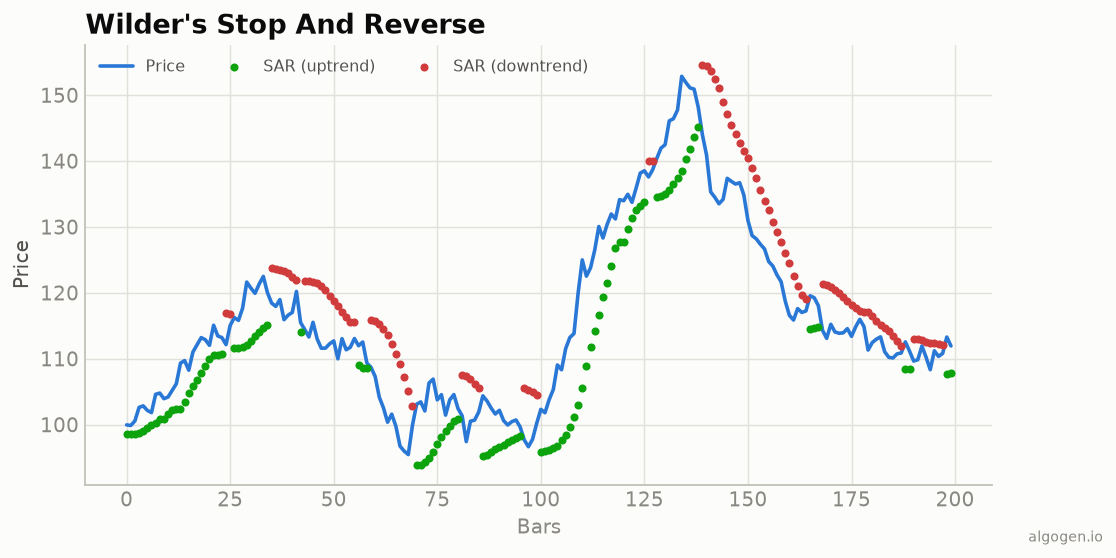
The Parabolic SAR appeared in New Concepts in Technical Trading Systems (1978), the same volume that gave us the RSI, ATR, and ADX. Wilder called it the Parabolic Time/Price System, and “SAR” — Stop And Reverse — describes its mechanic exactly: it’s an always-in-the-market system that holds a position until its trailing stop is hit, then reverses to the opposite side.
The problem: exits, not entries
Here’s what makes it special. Most traders obsess over entries and treat exits as an afterthought — which is backwards, since exits determine how much of a move you actually keep and how large your losses grow. Wilder built the Parabolic SAR as a disciplined, mechanical answer to the exit question: a stop level that trails the trade and tightens over time.
That “tightens over time” idea is the clever core. Wilder reasoned that the longer a trend runs and the further it extends, the less room it should be given to pull back before you bail. So he made the stop accelerate: the acceleration factor starts small (0.02) and increases each time the trend makes a new extreme, up to a cap (0.20). Early in a trend the stop trails loosely, giving the move room to breathe; late in a trend it hugs price tightly, protecting accumulated profit. The accelerating stop traces a parabola-like arc, which is where the name comes from.
A piece of a bigger philosophy
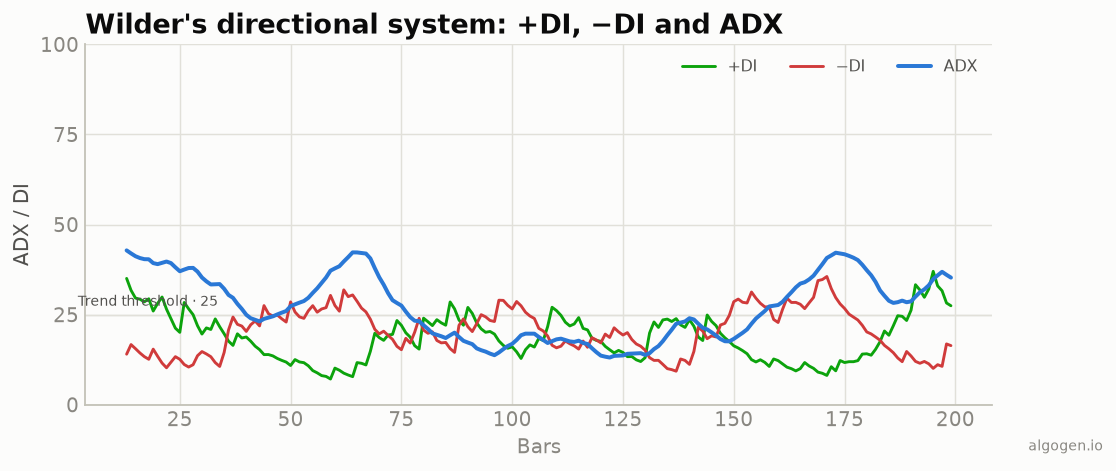
The Parabolic SAR is also a window into how Wilder thought. He wasn’t selling a magic entry oracle; he was building a complete system with defined risk and defined exits, of which the SAR was the money-management engine. He even suggested pairing it with his own ADX — using ADX to confirm a trend is strong enough to bother trading, then using the SAR to trail it. That systems mindset — entries, exits, and a filter, all defined in advance — is a big part of why his tools became foundational to the trend-following and systematic-trading era that followed.
An ancestor of the modern trailing stop
The Parabolic SAR’s deepest legacy isn’t the dots — it’s the idea it made concrete: that your exit should adapt to the trade’s own progress, tightening as profit accumulates. That concept echoes through tools invented decades later. The Chandelier Exit trails a stop at a multiple of ATR below the highest high; the SuperTrend indicator flips an ATR-based band much as the SAR flips its dots. Different math, same Wilder-descended philosophy: define your exit mechanically, and let it ratchet with the market rather than sit at a fixed price. In an era when most traders still used static stops (or, worse, none), Wilder’s self-tightening reverse system was genuinely ahead of its time — which is why the concept long outlived any debate about the indicator’s own win rate.
Why it endured
The Parabolic SAR survived for the usual reasons — it’s precisely specified and cheap to compute — but also because it fills a genuine gap. Plenty of indicators tell you when to get in; very few give you a clean, mechanical rule for getting out. The SAR does, and its visual is unmistakable: a string of dots trailing price and flipping sides. When charting software arrived, those dots became one of the most recognizable overlays on any platform.
It’s not without flaws — it whipsaws mercilessly in ranges, and being always-in means it’s always exposed — but as a trailing-stop concept it was ahead of its time. And, like every tool in this series, it’s just arithmetic: a recursive stop, an extreme point, and an acceleration factor. You can build Wilder’s exact 1978 system in a few dozen lines, which is what we do in the implementation posts.
This post is educational, not financial advice. Indicators describe the past; they don’t predict the future. Backtest anything before you risk real money on it.