The Exponential Moving Average has the most unlikely backstory of any indicator in this series. It didn’t come from a trader, a chartist, or a market analyst. It came from anti-submarine warfare, took a detour through naval inventory management, and finally reached the stock market in the hands of an actual rocket scientist. If you ever doubted that trading tools are borrowed from other fields, the EMA settles it.
Born tracking submarines
The core technique — exponential smoothing — is largely credited to Robert Goodell Brown, who worked for the U.S. Navy during World War II. His problem was fire-control: taking noisy positional data and computing a usable estimate of where a submarine actually was, updating continuously as new readings arrived. He needed a method that could smooth incoming data on the fly, leaning on the latest readings without throwing away everything that came before — and do it with the tiny amount of computing and storage available at the time. Exponential smoothing, where each new observation updates a running estimate by a fixed fraction, was the answer.
The 1950s: forecasting spare parts
After the war, Brown applied the same idea to a decidedly less dramatic problem: forecasting demand for spare parts in the Navy’s supply system. Inventory forecasting is exactly the kind of thing exponential smoothing is good at — recent demand matters more than ancient demand, and you can’t afford to store years of history for every one of thousands of parts. Brown showed it worked beautifully and cheaply, the Navy adopted it across inventory programs, and in 1956 he presented the method at a meeting of the Operations Research Society of America. His 1959 book, Statistical Forecasting for Inventory Control, put it on the map. Around the same time, Charles C. Holt independently developed closely related methods (the lineage behind “Holt-Winters” smoothing) — a reminder that good ideas often arrive from several directions at once.
The rocket scientist who put it on a stock chart
Here’s the delightful part. The person generally credited with first applying exponential smoothing to stock prices was P. N. “Pete” Haurlan, who was — genuinely — a rocket scientist at NASA’s Jet Propulsion Laboratory in the early 1960s. Haurlan worked on real-time telemetry for spacecraft, which meant two things: he understood smoothing techniques intimately, and, crucially, he had access to a computer at a time when almost no trader did. He used exponential moving averages to track stock prices and published work describing them (he referred to the values with the language of “trend” tracking). In other words, the tool that computed a rocket’s trajectory got repurposed to compute a stock’s.
Why it caught on in markets
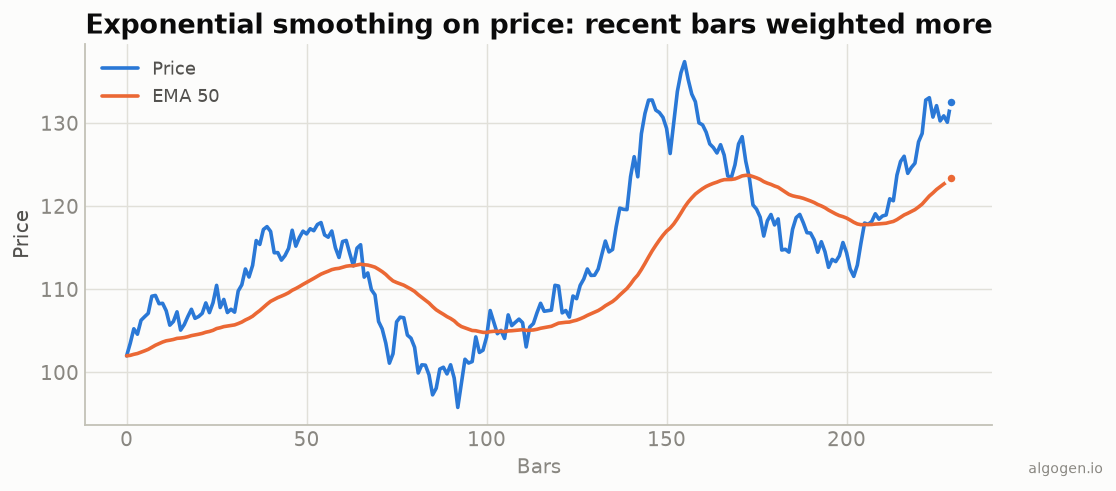
Once computers reached traders’ desks, the EMA had a decisive practical advantage over the simple moving average: it needs far less memory. An SMA has to store the last N prices to know which one to drop; an EMA only needs the previous EMA value and the new price. In the early days of limited computing, that efficiency mattered enormously, and it made the EMA a natural building block. Gerald Appel’s MACD is built from EMAs; countless other indicators use them under the hood.
The descendants
Traders being traders, the EMA soon spawned “faster” variants that try to cut its lag further. In 1994, Patrick Mulloy introduced the Double Exponential Moving Average (DEMA) and Triple Exponential Moving Average (TEMA) in Technical Analysis of Stocks & Commodities, using clever combinations of EMAs of EMAs to reduce lag without simply shortening the period. Others followed with Hull, Zero-Lag, and Kaufman’s Adaptive moving averages. Every one of them is built on Brown’s exponential-smoothing recurrence — proof that the humble EMA is less a single indicator than a foundation other tools are stacked on.
Today the EMA sits next to the SMA in every platform’s toolbox, its origins in submarine tracking and rocket telemetry long forgotten. But that’s the pattern this whole series keeps uncovering: the “market indicators” traders treat as native to finance are usually clever imports from engineering and statistics — and, being just arithmetic, they’re yours to rebuild, which is what we do in the implementation posts.
This post is educational, not financial advice. Indicators describe the past; they don’t predict the future. Backtest anything before you risk real money on it.
Sources and further reading
- Statistical Forecasting for Inventory Control (Royal Statistical Society and Oxford Academic)