Most of the indicators you’ll ever use came from a surprisingly small number of people, and one name comes up again and again: J. Welles Wilder Jr. If you use the RSI, the Average True Range, the Average Directional Index, or the Parabolic SAR, you are using Wilder’s work. He didn’t invent them as a professor publishing in journals. He invented them as a working guy who wanted tools that actually did something, which is about the most Mustachian origin story an indicator can have.
An engineer who took the scenic route
Wilder trained as a mechanical engineer — a degree from North Carolina State University in 1962 — and before he ever drew a chart in anger he built a successful real-estate practice in Greensboro, North Carolina. That background matters. He didn’t approach markets with mysticism; he approached them the way an engineer approaches a machine — measure it, model it, build an instrument to read it. When he turned his attention to commodities trading in the 1970s, he brought a slide-rule sensibility to a field that was, at the time, mostly hand-drawn trendlines and gut feel.
The book that launched a thousand indicators
In 1978 Wilder published a slim, dense volume called New Concepts in Technical Trading Systems. It is not a long book. It is one of the most influential trading books ever written, because packed into it were several brand-new indicators presented with the actual formulas and worked examples — no hand-waving. The Relative Strength Index was one of them, sharing the pages with ATR, ADX/DMI, the Parabolic SAR, and the Commodity Selection Index.
Think about that: a single 1978 book seeded a huge fraction of the indicator list on every trading platform built since. Traders bought it, computed the formulas by hand or on the earliest programmable calculators, and the tools spread from there.
Why he built it
Traders already had “momentum” — literally today’s price minus the price N bars ago. The problem is that raw momentum is an unbounded, jumpy number that’s a nightmare to compare. A momentum reading of “+4.20” means something totally different on a $30 commodity than on a $600 one, and it can spike to any value.
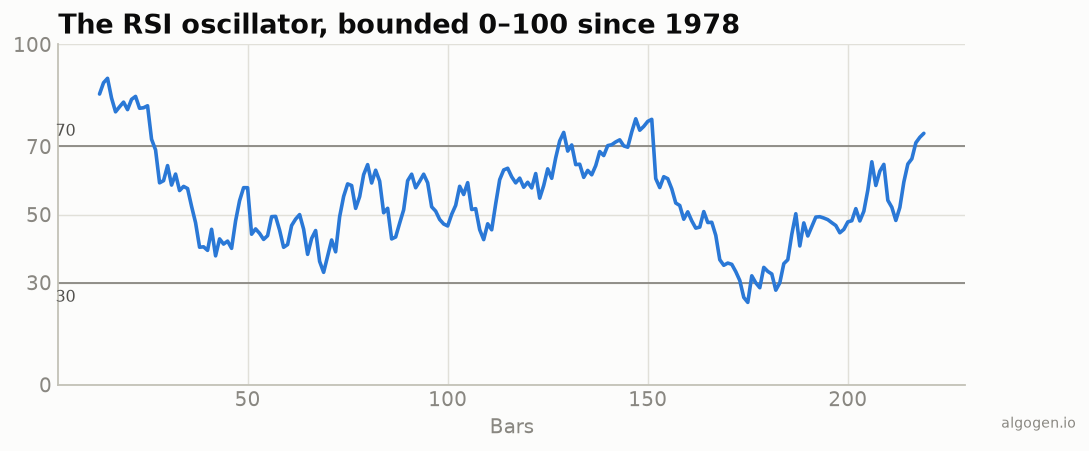
Wilder wanted a momentum measure that was normalized and bounded — one that always lived on the same 0-to-100 scale no matter the instrument or the volatility. His solution was to compare the average size of up-moves to the average size of down-moves and fold that ratio into a formula that mathematically cannot leave the 0–100 range. The result was smooth, comparable across markets, and easy to eyeball. That’s the RSI.
He also introduced the smoothing that still bears his approach: instead of a
plain moving average of gains and losses, each new bar updates the average by a
fraction (1/N). It gives the RSI a longer memory and is the reason a
by-the-book RSI looks slightly different from a naive simple-average version.
Why 14?
The default period is 14, and it wasn’t arbitrary. Wilder worked from the idea of a half-cycle: 14 is half of 28, roughly a lunar month and close to a month of trading days, so it captured half of the cycle he was measuring. It was a sensible starting point, not the output of optimizing over historical data — and it simply never left. It’s a default, not a law of physics — but defaults have gravity, and four-plus decades later almost every platform still ships RSI(14) out of the box.
The naming confusion worth clearing up
Here’s a myth to kill: the RSI has nothing to do with “relative strength” in the sense of comparing one asset against another (like a stock versus the S&P 500). That’s a different, unrelated concept that unfortunately shares a name. Wilder’s RSI is internal — it measures a single instrument against its own recent history. The overlapping terminology has confused newcomers for decades, so if you’ve been quietly puzzled, you were right to be. Same words, different tool.
How it conquered every chart
The timing was perfect. Wilder’s book landed just as personal computers and early charting software were arriving on traders’ desks. An indicator defined by a clean, deterministic formula is exactly the kind of thing software loves to compute, and the RSI was trivial to program. It got baked into the first generations of charting packages, then into every one that followed, and now it’s a default study on platforms Wilder never could have imagined.
That’s also the quiet lesson here. The RSI didn’t win because it was magic. It won because it was simple, well-specified, and free to reproduce. Nobody owns the formula. You can build it yourself this afternoon — and in the implementation posts in this series, you will, in five different languages. Wilder would probably approve; he was, after all, an engineer who just wanted the tool to work.
This post is educational, not financial advice. Indicators describe the past; they don’t predict the future. Backtest anything before you risk real money on it.
Sources and further reading
- New Concepts in Technical Trading Systems (Windsor Books)