Pine has ta.vwap built in and it handles the session reset automatically, so
plotting the classic intraday VWAP is a one-liner. We’ll add bands and an anchored
version. See the explainer for the concept.
What you’ll need
- A TradingView account (free tier is fine)
- The Pine Editor, on an intraday chart for session VWAP
Session VWAP with bands
//@version=5
indicator("AlgoGen VWAP", shorttitle="AG VWAP", overlay=true)

[vwapVal, upper1, lower1] = ta.vwap(hlc3, anchor = timeframe.change("D"), stdev_mult = 2.0)

plot(vwapVal, "VWAP", color=#eb6834, linewidth=2)
plot(upper1, "+2σ", color=color.new(#4a3aa7, 40))
plot(lower1, "−2σ", color=color.new(#4a3aa7, 40))
ta.vwap takes the source (hlc3 is TradingView’s typical price, (H+L+C)/3),
an anchor that says when to reset (here, each day), and an optional
stdev_mult that also returns the ±band series. That’s the whole intraday VWAP
plus deviation bands.
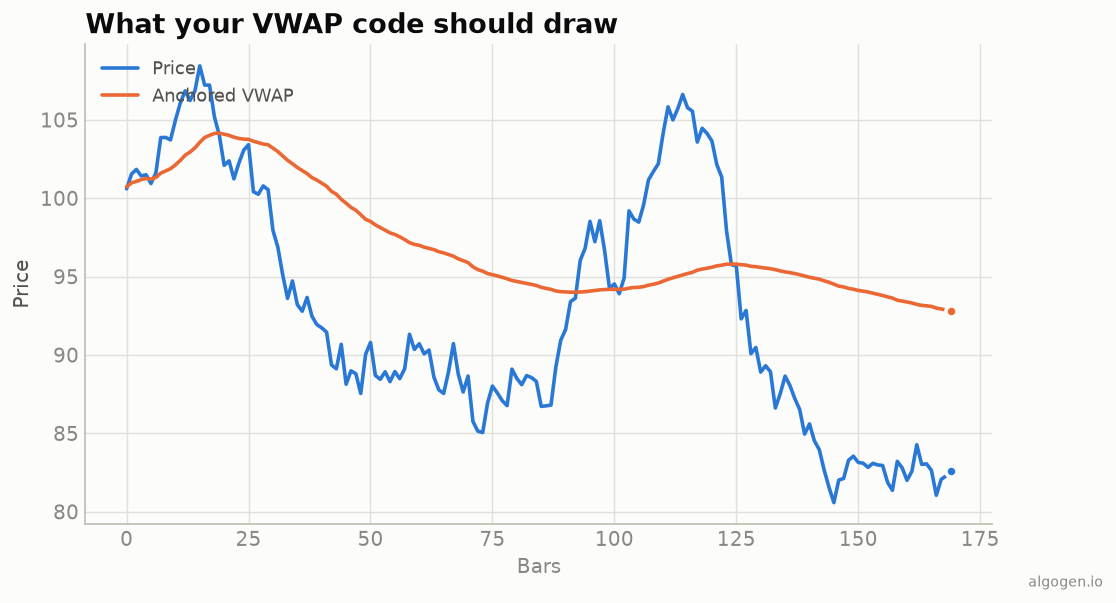
Anchored VWAP from a condition
To anchor VWAP from a point you choose — say the year’s highest high — reset the accumulation when that condition fires:
//@version=5
indicator("AlgoGen Anchored VWAP", overlay=true)
anchorCond = high == ta.highest(high, 252)      // e.g. a new 1-year high
var float cumPV = na
var float cumV  = na
if anchorCond or na(cumPV)
    cumPV := 0.0
    cumV  := 0.0
cumPV += hlc3 * volume
cumV  += volume
plot(cumPV / cumV, "Anchored VWAP", color=#eb6834, linewidth=2)
A VWAP bias filter
Many intraday traders use VWAP as a simple regime switch — only long above it, only short below it:
[vwapVal, _, _] = ta.vwap(hlc3, timeframe.change("D"), 2.0)
aboveVwap = close > vwapVal
bgcolor(aboveVwap ? color.new(#0ca30c, 92) : color.new(#d03b3b, 92))
plotshape(ta.crossover(close, vwapVal),  "Reclaim", shape.triangleup,   location.belowbar, color=#0ca30c, size=size.tiny)
plotshape(ta.crossunder(close, vwapVal), "Lose",    shape.triangledown, location.abovebar, color=#d03b3b, size=size.tiny)
The background tints green above VWAP and red below, and the triangles mark where price reclaims or loses the line — a clean way to see the session bias at a glance.
Gotchas
- Intraday for session VWAP.
ta.vwapwith a daily anchor is meaningful on intraday charts; on a daily chart, each “session” is one bar and the line is trivial. Use anchored VWAP on higher timeframes. hlc3is the typical price. Passingcloseinstead gives a close-only VWAP — valid but non-standard.- Volume required. No reliable volume, no reliable VWAP.
Same indicator elsewhere: Python, MQL5, EasyLanguage, NinjaScript. Then test a VWAP strategy in AlgoGen.
This post is educational, not financial advice. Indicators describe the past; they don’t predict the future. Backtest anything before you risk real money on it.
Sources and further reading
- The Total Cost of Transactions on the NYSE (The Journal of Finance)
- Pine Script built-ins (TradingView)