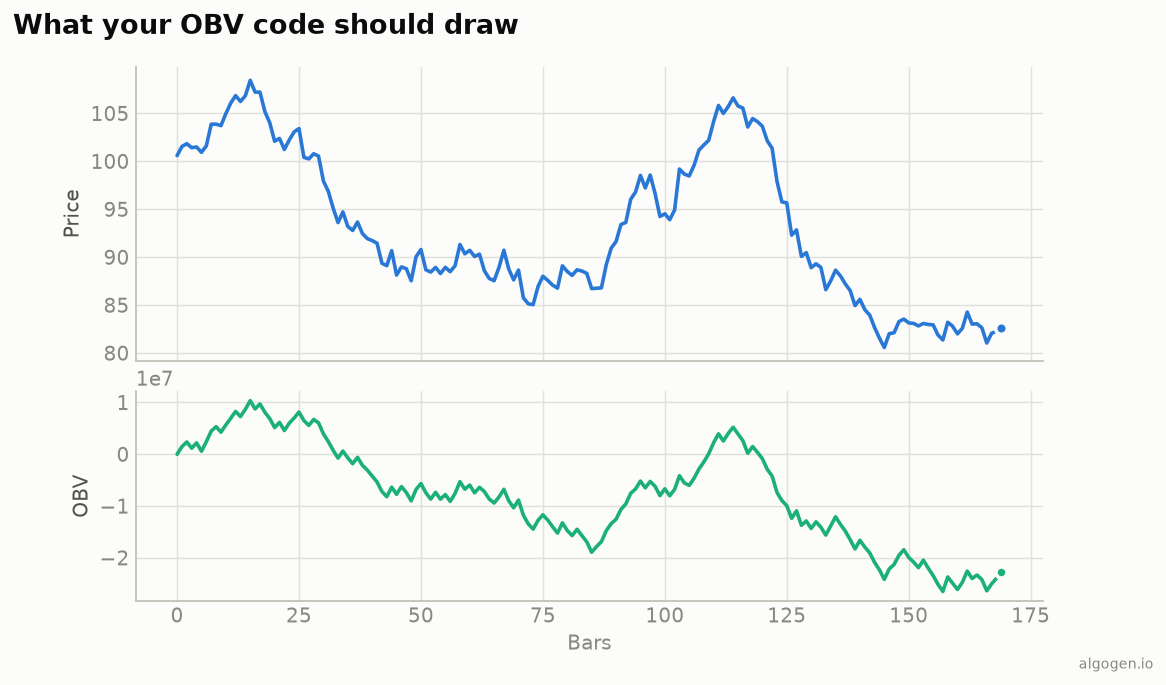
Pine has ta.obv as a built-in variable, so plotting On-Balance Volume takes one
line. We’ll show that, the from-scratch version, and a useful OBV moving average
for signals. See the explainer for the idea.
What you’ll need
- A TradingView account (free tier is fine)
- The Pine Editor
The source
//@version=5
indicator("AlgoGen OBV", shorttitle="AG OBV", overlay=false)

obv = ta.obv
signalLen = input.int(20, "OBV MA length")
obvMa = ta.sma(obv, signalLen)

plot(obv,   "OBV",    color=#1baf7a, linewidth=2)
plot(obvMa, "OBV MA", color=#eb6834, linewidth=2)
ta.obv is a built-in series that already applies Granville’s rule cumulatively.
Adding a moving average of OBV gives you a signal line — OBV crossing its own MA is
a common way to trade the indicator, and it turns a directionless running total
into something with discrete triggers, like the aqua line in the output chart.
The from-scratch version
//@version=5
indicator("AlgoGen OBV (manual)", overlay=false)
var float obvManual = 0.0
obvManual := close > close[1] ? obvManual + volume :
             close < close[1] ? obvManual - volume : obvManual
plot(obvManual, color=#1baf7a, linewidth=2)
var makes obvManual persist across bars so the running total accumulates; the
:= reassignment applies the up/down/flat rule.
Divergence highlighting and alerts
A more advanced touch is flagging when OBV and price disagree over a lookback:
len = input.int(20, "Divergence lookback")
priceUp = close > close[len]
obvDown = ta.obv < ta.obv[len]
bgcolor(priceUp and obvDown ? color.new(color.red, 85) : na, title="Bearish divergence")
alertcondition(priceUp and obvDown, "OBV bearish divergence", "Price up but OBV down")
This tints the background and can fire an alert when price makes ground but the volume tally doesn’t follow — the distribution warning from the explainer, made visible.
Gotchas
varis essential. Without it, the running total resets every bar and you get garbage. This is the defining feature of a cumulative indicator in Pine.- Volume availability. Not every symbol has reliable volume (some indices,
some forex). Pine will error or show
nawhere volume is missing — OBV is only meaningful where volume is real. - Absolute scale. The OBV axis numbers are arbitrary; TradingView auto-scales the pane, so read the shape, not the values.
Same indicator elsewhere: Python, MQL5, EasyLanguage, NinjaScript. Then test an OBV/MA cross in AlgoGen.
This post is educational, not financial advice. Indicators describe the past; they don’t predict the future. Backtest anything before you risk real money on it.
Sources and further reading
- New Key to Stock Market Profits (Google Books)
- Pine Script built-ins (TradingView)