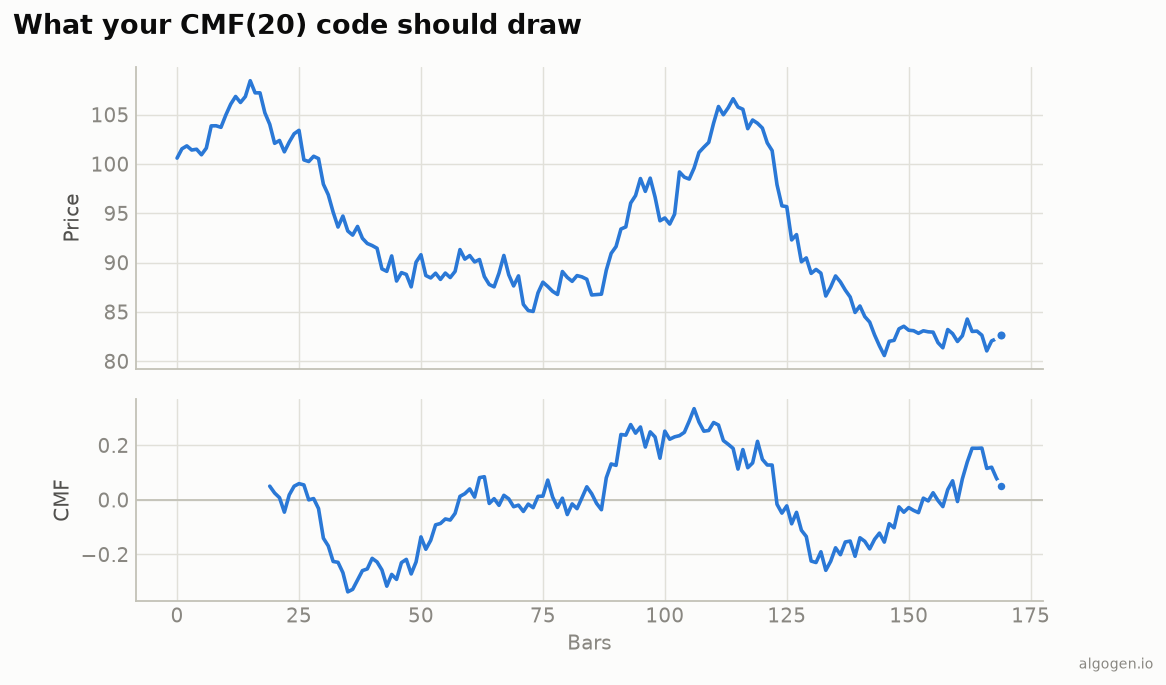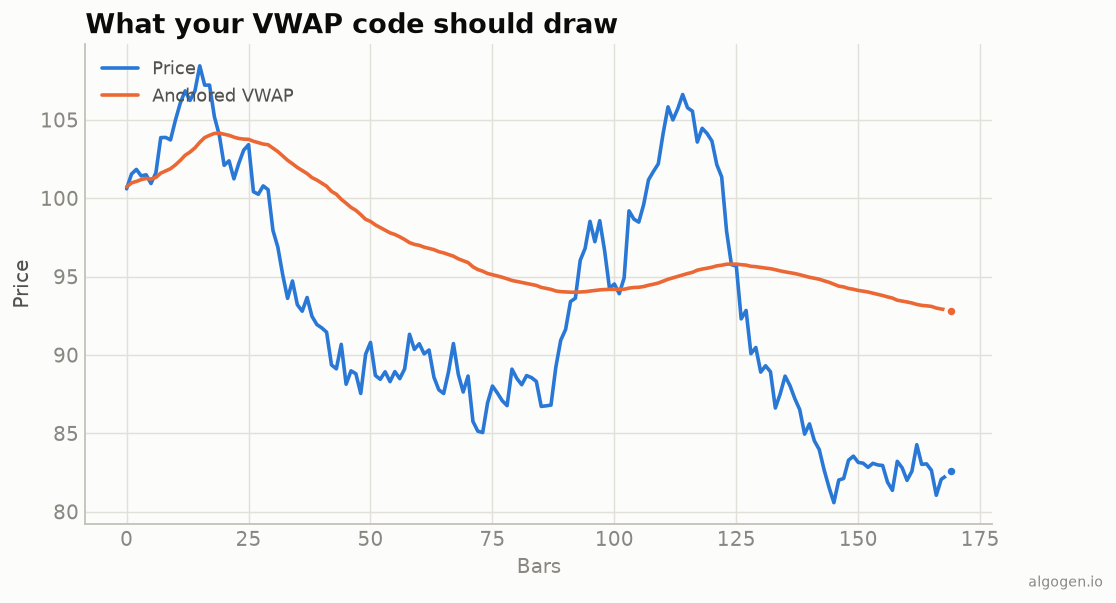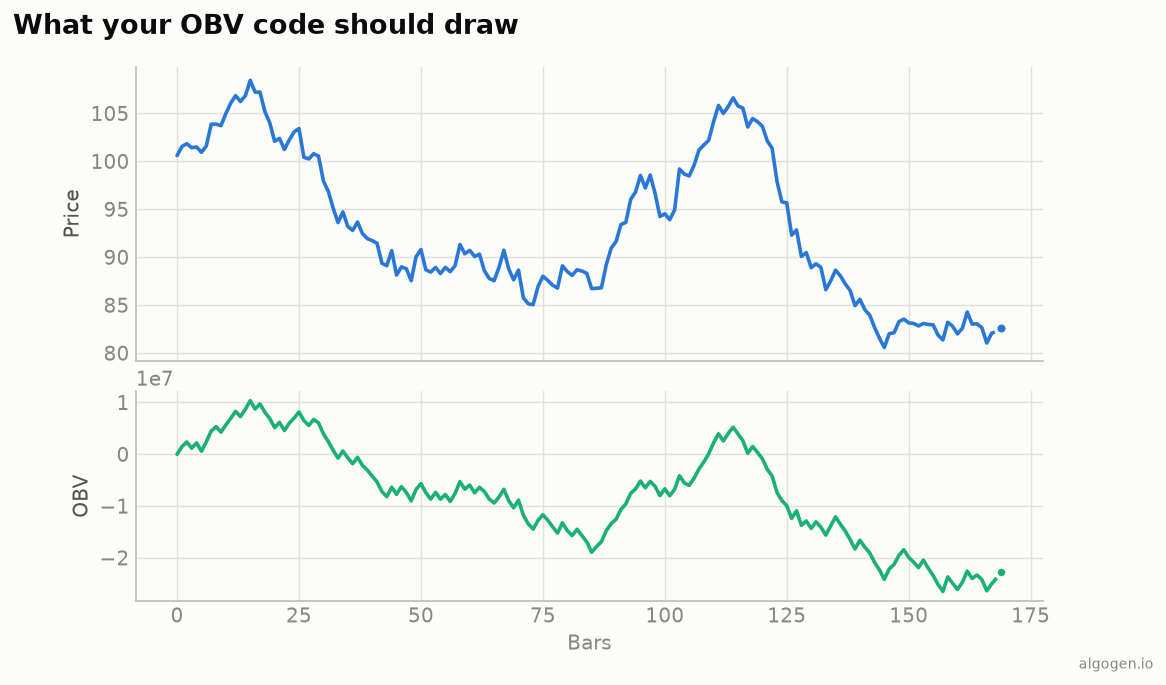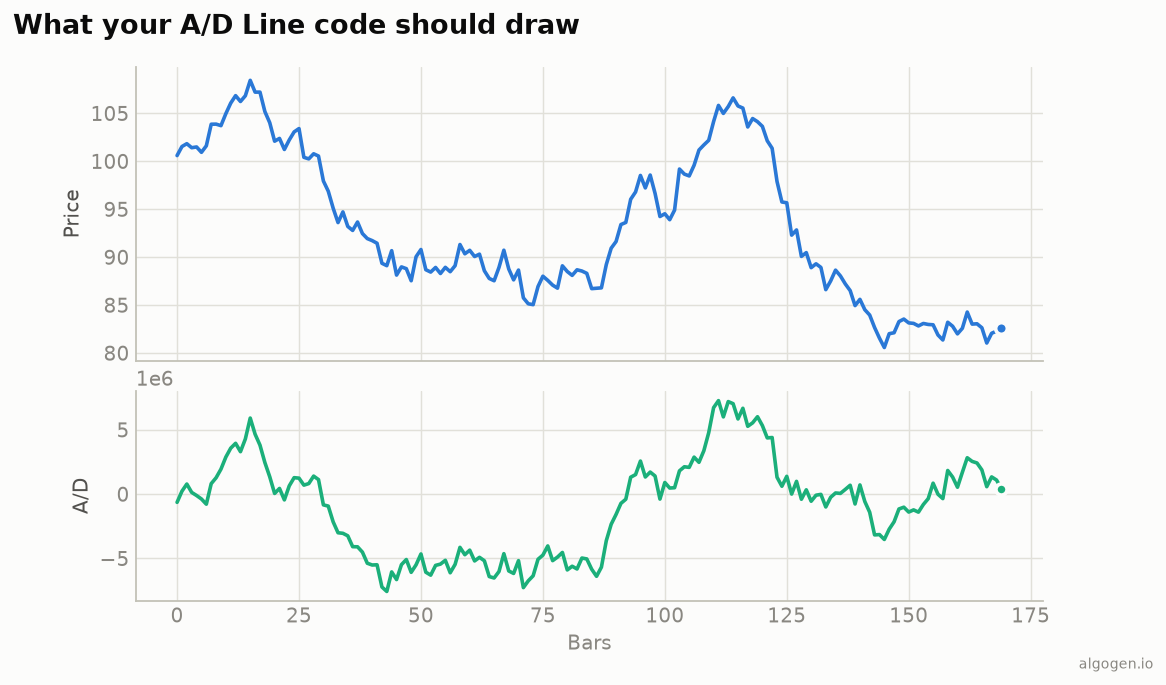
Pine has ta.accdist as a built-in variable, so the A/D Line is a one-liner — and the
Chaikin Oscillator is two more. See
the explainer for the concept.
What you’ll need
- A TradingView account (free tier is fine)
- The Pine Editor
The source
//@version=5
indicator("AlgoGen A/D Line", shorttitle="AG AD", overlay=false)

plot(ta.accdist, "A/D Line", color=#1baf7a, linewidth=2)
ta.accdist is the built-in cumulative Accumulation/Distribution Line — the running
total from the output chart.
From scratch
//@version=5
indicator("AlgoGen A/D (manual)", overlay=false)
mfm = (high == low) ? 0.0 : ((close - low) - (high - close)) / (high - low)
var float ad = 0.0
ad := ad + mfm * volume
plot(ad, color=#1baf7a, linewidth=2)
The high == low guard handles flat bars; var makes ad persist so the sum
accumulates. This reproduces ta.accdist.
The Chaikin Oscillator
chaikinOsc = ta.ema(ta.accdist, 3) - ta.ema(ta.accdist, 10)
plot(chaikinOsc, "Chaikin Osc", color=#2a78d6, linewidth=2)
hline(0, "Zero", color=color.gray)
A MACD of the A/D Line — a zero-centered momentum read on money flow, and Chaikin’s own companion indicator.
Highlighting divergence
The A/D Line’s best use is spotting divergence from price — worth automating:
len = input.int(20, "Divergence lookback")
priceUp = close > close[len]
adDown  = ta.accdist < ta.accdist[len]
bgcolor(priceUp and adDown ? color.new(color.red, 85) : na, title="Bearish divergence")
alertcondition(priceUp and adDown, "A/D bearish divergence", "Price up but A/D down")
When price makes ground over the window but the A/D Line doesn’t follow, the background tints and an alert can fire — the distribution warning from the explainer, made visible and testable.
Gotchas
varfor the manual sum. Without it the running total resets every bar. Not needed forta.accdist(built in), essential for the manual version.- Read slope, not level. The A/D Line is a cumulative total on an arbitrary scale; watch direction and divergence.
- Volume required. No real volume, no meaningful A/D Line.
Same indicator elsewhere: Python, MQL5, EasyLanguage, NinjaScript. Then test an A/D rule in AlgoGen.
This post is educational, not financial advice. Indicators describe the past; they don’t predict the future. Backtest anything before you risk real money on it.
Sources and further reading
- Pine Script built-ins (TradingView)