SuperTrend in NinjaScript keeps the final bands in Series<double> and carries the
line and direction bar to bar. See the explainer for
the logic.
What you’ll need
- NinjaTrader 8
- New → NinjaScript Editor → Indicators → New Indicator, name it
AlgoGenSuperTrend
The source
#region Using declarations
using System;
using System.Windows.Media;
using NinjaTrader.NinjaScript;
using NinjaTrader.NinjaScript.Indicators;
#endregion

namespace NinjaTrader.NinjaScript.Indicators
{
    public class AlgoGenSuperTrend : Indicator
    {
        private Series<double> fu, fl, st;

        protected override void OnStateChange()
        {
            if (State == State.SetDefaults)
            {
                Name        = "AlgoGen SuperTrend";
                Description = "SuperTrend (ATR bands)";
                AtrPeriod = 10; Mult = 3.0;
                IsOverlay = true;

                AddPlot(new Stroke(Brushes.MediumSeaGreen, 2), PlotStyle.Line, "ST");
            }
            else if (State == State.DataLoaded)
            {
                fu = new Series<double>(this);
                fl = new Series<double>(this);
                st = new Series<double>(this);
            }
        }

        protected override void OnBarUpdate()
        {
            if (CurrentBar < AtrPeriod)
                return;

            double hl2 = (High[0] + Low[0]) / 2.0;
            double band = Mult * ATR(AtrPeriod)[0];
            double ub = hl2 + band, lb = hl2 - band;

            if (CurrentBar == AtrPeriod)
            {
                fu[0] = ub; fl[0] = lb; st[0] = ub;
            }
            else
            {
                fu[0] = (ub < fu[1] || Close[1] > fu[1]) ? ub : fu[1];
                fl[0] = (lb > fl[1] || Close[1] < fl[1]) ? lb : fl[1];

                if (st[1] == fu[1])
                    st[0] = Close[0] > fu[0] ? fl[0] : fu[0];
                else
                    st[0] = Close[0] < fl[0] ? fu[0] : fl[0];
            }

            Value[0] = st[0];
            PlotBrushes[0][0] = st[0] == fl[0] ? Brushes.MediumSeaGreen : Brushes.IndianRed;
        }

        #region Properties
        [NinjaScriptProperty][System.ComponentModel.DataAnnotations.Range(1, int.MaxValue)]
        [System.ComponentModel.Display(Name = "AtrPeriod", GroupName = "Parameters", Order = 0)]
        public int AtrPeriod { get; set; }

        [NinjaScriptProperty][System.ComponentModel.DataAnnotations.Range(0.1, double.MaxValue)]
        [System.ComponentModel.Display(Name = "Mult", GroupName = "Parameters", Order = 1)]
        public double Mult { get; set; }
        #endregion
    }
}
Compile & apply
- Press F5 to compile.
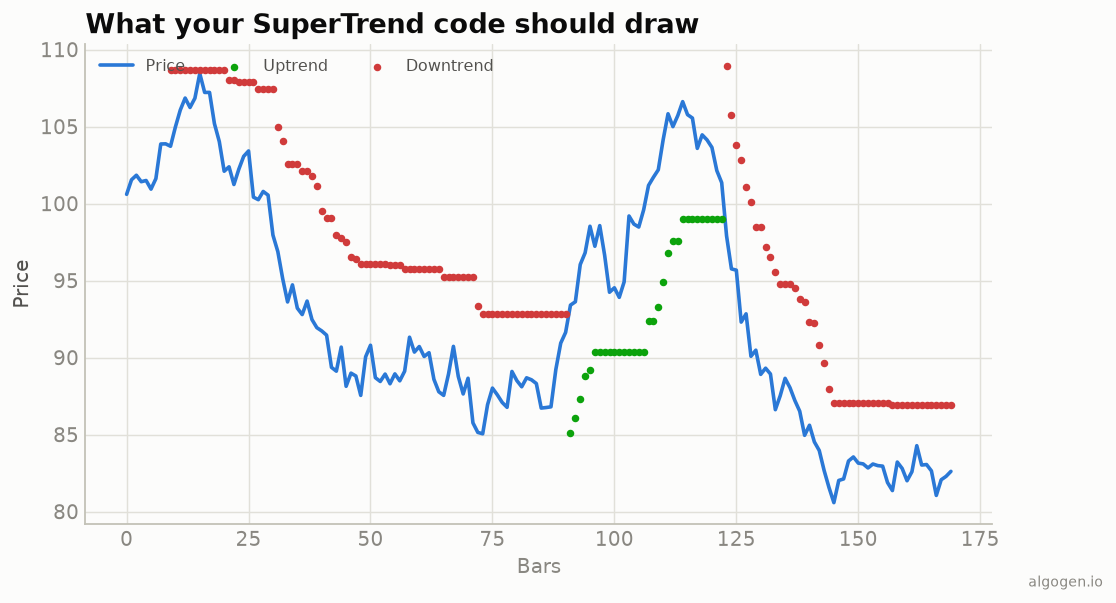
- Add AlgoGen SuperTrend to a chart; the line overlays price, green below in uptrends and red above in downtrends, matching the output chart.
Gotchas
Series<double>state. Keepingfu,fl, andstas Series lets the[1]band-locking references work and survive reloads — the same reason the MACD kept its EMAs as Series.- Seed the first computed bar. At
CurrentBar == AtrPeriod, initialise the bands and line so later[1]reads exist. PlotBrushesfor colour. Colour the line by whether it equals the lower band (uptrend) or upper band (downtrend).
That’s the five-language set: Python, MQL5, Pine Script, EasyLanguage, and this one. Now test a SuperTrend system in AlgoGen.
This post is educational, not financial advice. Indicators describe the past; they don’t predict the future. Backtest anything before you risk real money on it.
Sources and further reading
- NinjaScript system indicator methods (NinjaTrader)