SuperTrend has become one of the most popular indicators of the modern era, and it’s easy to see why: it draws a single line that sits below price in an uptrend and above it in a downtrend, flipping sides when the trend changes. No panels, no divergence hunting — just “are we long or short right now?” It’s built on the ATR, so let’s do the math.
The one-sentence job
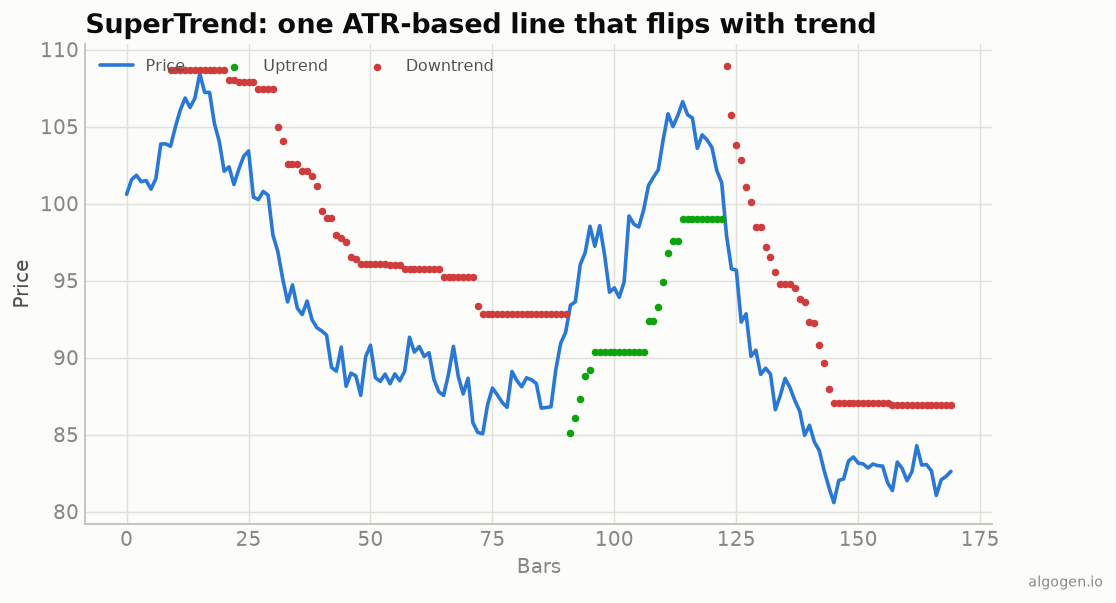
SuperTrend plots a single trailing line, offset from price by a multiple of ATR, that flips from below price (uptrend) to above price (downtrend) when price closes through it. Line below and green = uptrend; line above and red = downtrend.
The formula
Start with volatility bands around the bar’s midpoint. Defaults: ATR period 10, multiplier 3:
Basic Upper Band = (High + Low) / 2 + multiplier × ATR
Basic Lower Band = (High + Low) / 2 − multiplier × ATR
Then comes the important part — the band-locking rules that stop the line from loosening against the trend:
- The final upper band only moves down (tightening) while price stays below it; if price closes above it, the band resets.
- The final lower band only moves up (tightening) while price stays above it.
Finally, the SuperTrend line is whichever band is currently active, and it flips when price closes through it: if price closes above the upper band, the line jumps to the lower band (now an uptrend); if price closes below the lower band, it jumps to the upper band (downtrend). On the chart above you can see the line “ratchet” toward price during a trend and then flip to the other side when price breaks through.
That band-locking is what gives SuperTrend its clean, stair-stepping behaviour — without it, the line would wobble and flip constantly.
How to read it
Trend and bias. Line below price (green) → uptrend, hold longs. Line above price (red) → downtrend, hold shorts. It couldn’t be more direct.
The flip = signal. When the line flips sides, SuperTrend is calling a trend change — a stop-and-reverse point, much like the Parabolic SAR.
Trailing stop. Even if you don’t trade the flips mechanically, the SuperTrend line is an excellent trailing stop that tightens with the trend — many traders use it purely for exits on top of another entry.
SuperTrend vs Parabolic SAR
They’re cousins — both are always-in, flipping trailing systems — but:
- Parabolic SAR uses an accelerating offset (dots that speed up toward price).
- SuperTrend uses an ATR-based offset (a band a fixed number of ATRs away).
SuperTrend tends to be smoother and flip less often than the SAR, giving trends more room; the SAR tightens faster. Different feel, same job.
The settings
ATR 10, multiplier 3 is the common default. A larger multiplier = a wider band = fewer, later flips (more room, more give-back); a smaller multiplier = tighter, twitchier. This one parameter is the main dial, so it’s the first thing to test on your market.
Where it lies to you
- Whipsaws in ranges. Like every flipping trend tool, SuperTrend gets chopped up in sideways markets, flipping back and forth for a string of small losses. Pair it with a trend/volatility filter (e.g. ADX) to sit out the chop.
- Always in the market. As a pure system it’s never flat — constantly exposed, including during the ranges where it does worst.
- It lags reversals. By construction it flips after price has moved through the band, so it gives back some of every move at the turn.
- Multiplier sensitivity. The right multiplier varies a lot by instrument and timeframe; a setting that’s smooth on one market whipsaws on another.
SuperTrend’s popularity is well earned: it’s visually unambiguous, it doubles as a trailing stop, and it’s built on the honest volatility measure of ATR. Just respect that “one clean line” hides the same range-bound weakness every trend flipper has.
Now go test it, don’t trust it
Does a SuperTrend flip system — or SuperTrend as a trailing stop with a separate entry — actually work on your market, and at what multiplier? That’s a backtest. Build it in AlgoGen and tune it. Then build SuperTrend yourself in Python, MQL5, Pine Script, EasyLanguage, or NinjaScript.
This post is educational, not financial advice. Indicators describe the past; they don’t predict the future. Backtest anything before you risk real money on it.