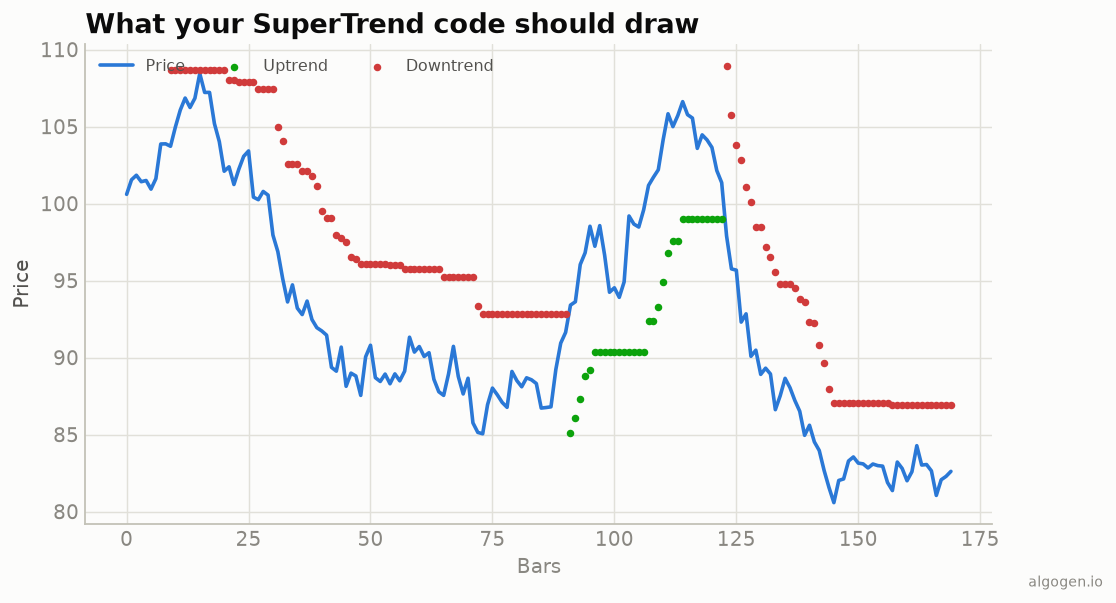
MetaTrader has no built-in SuperTrend, so this is a genuinely useful custom indicator — and a good test of the band-locking state logic (see the explainer).
What you’ll need
- MetaTrader 5 with MetaEditor
- Save as
AlgoGen.SuperTrend.mq5underMQL5/Indicators/
The source
//+------------------------------------------------------------------+
//|                                           AlgoGen.SuperTrend.mq5 |
//|                                          Copyright 2026, AlgoGen |
//|                                           https://www.algogen.io |
//+------------------------------------------------------------------+
#property copyright "Copyright 2026, AlgoGen"
#property link      "https://www.algogen.io"
#property version   "1.00"
#property indicator_chart_window
#property indicator_buffers 4
#property indicator_plots   1

#property indicator_label1  "SuperTrend"
#property indicator_type1   DRAW_COLOR_LINE
#property indicator_color1  clrMediumSeaGreen, clrIndianRed
#property indicator_width1  2

input int    InpAtrPeriod = 10;
input double InpMult       = 3.0;

double STBuffer[], ColorBuffer[], FuBuffer[], FlBuffer[];
int    atrHandle;

int OnInit()
  {
   SetIndexBuffer(0, STBuffer,    INDICATOR_DATA);
   SetIndexBuffer(1, ColorBuffer, INDICATOR_COLOR_INDEX);
   SetIndexBuffer(2, FuBuffer,    INDICATOR_CALCULATIONS);
   SetIndexBuffer(3, FlBuffer,    INDICATOR_CALCULATIONS);
   atrHandle = iATR(_Symbol, _Period, InpAtrPeriod);
   if(atrHandle == INVALID_HANDLE) return(INIT_FAILED);
   IndicatorSetString(INDICATOR_SHORTNAME, "AlgoGen SuperTrend");
   return(INIT_SUCCEEDED);
  }

int OnCalculate(const int rates_total, const int prev_calculated,
                const datetime &time[], const double &open[],
                const double &high[],   const double &low[],
                const double &close[],  const long &tick_volume[],
                const long &volume[],   const int &spread[])
  {
   if(rates_total <= InpAtrPeriod) return(0);
   double atr[];
   if(CopyBuffer(atrHandle, 0, 0, rates_total, atr) <= 0) return(prev_calculated);

   int start = (prev_calculated > InpAtrPeriod + 1) ? prev_calculated - 1 : InpAtrPeriod;
   for(int i = start; i < rates_total; i++)
     {
      double hl2 = (high[i] + low[i]) / 2.0;
      double ub = hl2 + InpMult * atr[i];
      double lb = hl2 - InpMult * atr[i];

      FuBuffer[i] = (ub < FuBuffer[i - 1] || close[i - 1] > FuBuffer[i - 1]) ? ub : FuBuffer[i - 1];
      FlBuffer[i] = (lb > FlBuffer[i - 1] || close[i - 1] < FlBuffer[i - 1]) ? lb : FlBuffer[i - 1];

      if(STBuffer[i - 1] == FuBuffer[i - 1])
         STBuffer[i] = (close[i] > FuBuffer[i]) ? FlBuffer[i] : FuBuffer[i];
      else
         STBuffer[i] = (close[i] < FlBuffer[i]) ? FuBuffer[i] : FlBuffer[i];

      ColorBuffer[i] = (STBuffer[i] == FlBuffer[i]) ? 0 : 1; // 0 green up, 1 red down
     }
   return(rates_total);
  }
//+------------------------------------------------------------------+
Install & compile
- Drop it in
MQL5/Indicators/, press F7. - Drag onto a chart — the SuperTrend line overlays price, green below in uptrends and red above in downtrends, matching the output chart.
Gotchas
DRAW_COLOR_LINE. Lets the single line switch green/red per bar via the color index buffer.- Band-locking. The
FuBuffer/FlBufferratchet rules are the heart of it — without them the line flips every bar. They’re calculation buffers so they persist without being plotted. - First bars. Seed
STBuffer/FuBuffer/FlBufferat the first computed bar (here the loop’sstart) so[i-1]references exist. MQL4 ports directly by swapping theOnCalculatesignature and computing ATR manually or viaiATR.
Same indicator elsewhere: Python, Pine Script, EasyLanguage, NinjaScript. Then test it in AlgoGen.
This post is educational, not financial advice. Indicators describe the past; they don’t predict the future. Backtest anything before you risk real money on it.
Sources and further reading
- Technical indicator functions (MetaQuotes)