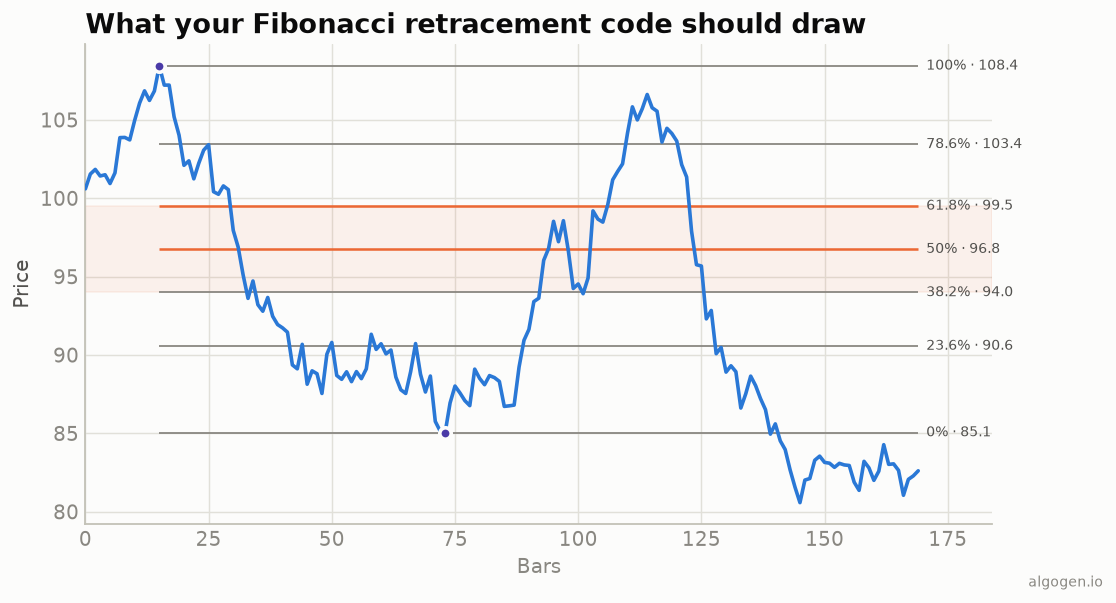
NinjaTrader has a manual Fibonacci drawing tool, but scripting it lets you auto-draw levels from a rule-based swing — the objective, testable approach (see the explainer).
What you’ll need
- NinjaTrader 8
- New → NinjaScript Editor → Indicators → New Indicator, name it
AlgoGenFibonacci
The source
#region Using declarations
using System;
using System.Windows.Media;
using NinjaTrader.NinjaScript;
using NinjaTrader.NinjaScript.Indicators;
#endregion

namespace NinjaTrader.NinjaScript.Indicators
{
    public class AlgoGenFibonacci : Indicator
    {
        private static readonly double[] Ratios =
            { 0.0, 0.236, 0.382, 0.5, 0.618, 0.786, 1.0 };

        protected override void OnStateChange()
        {
            if (State == State.SetDefaults)
            {
                Name        = "AlgoGen Fibonacci";
                Description = "Auto Fibonacci retracement";
                Lookback    = 90;
                IsOverlay   = true;
            }
        }

        protected override void OnBarUpdate()
        {
            if (CurrentBar < Lookback) return;

            double swingHigh = High[HighestBar(High, Lookback)];
            double swingLow  = Low[LowestBar(Low, Lookback)];
            double diff = swingHigh - swingLow;

            foreach (double r in Ratios)
            {
                double y = swingLow + r * diff;
                bool emph = r == 0.5 || r == 0.618;
                Draw.HorizontalLine(this, "fib_" + r, y,
                    emph ? Brushes.OrangeRed : Brushes.Gray);
                Draw.Text(this, "fiblbl_" + r, (r * 100).ToString("0.#") + "%",
                    0, y, Brushes.Gray);
            }
        }

        #region Properties
        [NinjaScriptProperty][System.ComponentModel.DataAnnotations.Range(2, int.MaxValue)]
        [System.ComponentModel.Display(Name = "Lookback", GroupName = "Parameters", Order = 0)]
        public int Lookback { get; set; }
        #endregion
    }
}
Compile & apply
- Press F5 to compile.
- Add AlgoGen Fibonacci to a chart; it draws the retracement levels of the last
Lookbackbars’ swing, matching the output chart.
Gotchas
HighestBar/LowestBarreturn the bars-ago offset of the extreme; indexHigh[...]/Low[...]with it to get the swing prices — the rule-based swing.- Reuse tag names. Passing the same
"fib_" + rtag each bar updates the line rather than stacking new ones, so the levels move cleanly as the swing changes. - 50% is a convention, not a Fibonacci ratio — included because Dow Theory favored the half-retracement.
- Golden-zone region. To shade the 38.2–61.8% zone, use
Draw.Rectanglebetween those two prices, or checkClose[0]against them for a signal:
double gLow  = swingLow + 0.382 * diff;
double gHigh = swingLow + 0.618 * diff;
if (Close[0] >= gLow && Close[0] <= gHigh)
    Draw.Dot(this, "inzone" + CurrentBar, false, 0, Low[0] - TickSize, Brushes.Orange);
- Extensions for targets. Add
1.272and1.618to theRatiosarray to draw extension levels beyond 100% for profit targets.
That’s the five-language set: Python, MQL5, Pine Script, EasyLanguage, and this one. Now test whether the levels hold in AlgoGen.
This post is educational, not financial advice. Indicators describe the past; they don’t predict the future. Backtest anything before you risk real money on it.
Sources and further reading
- NinjaScript system indicator methods (NinjaTrader)