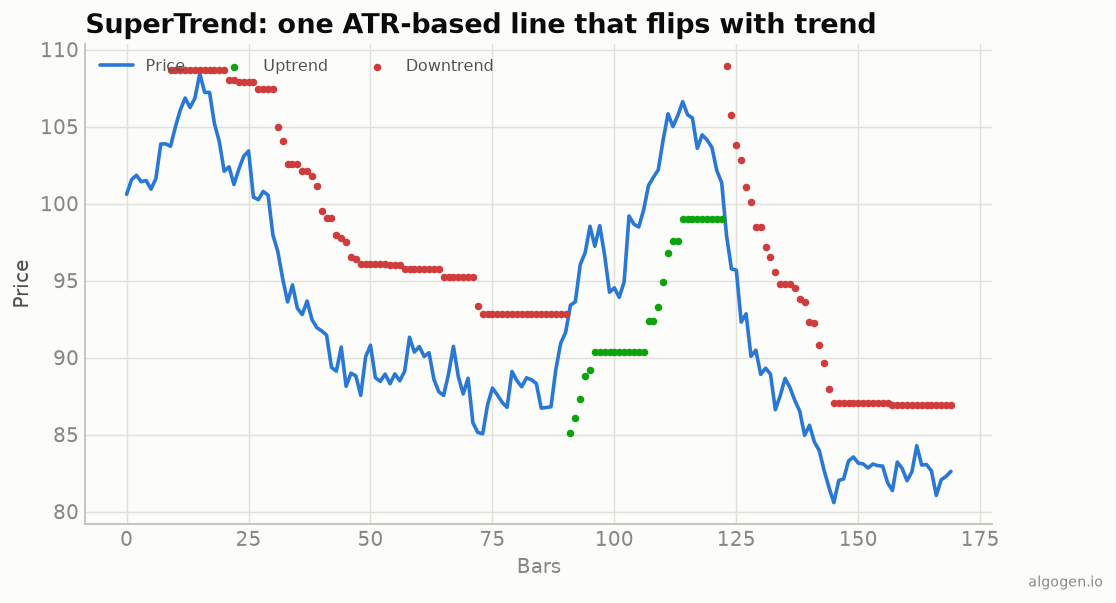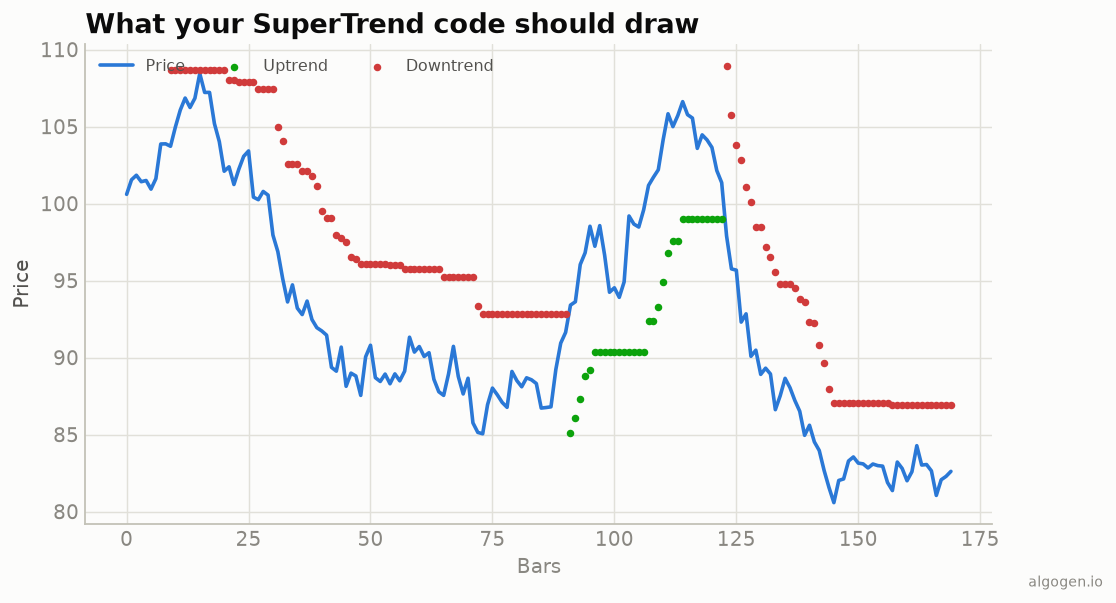
SuperTrend is another stateful indicator — like the Parabolic SAR, it needs a loop, because each bar’s band depends on the last. The explainer covers the logic; here it is faithfully in Python, band-locking and all.
What you’ll need
- Python 3.9+,
pandas/numpy high,low,closeseries.
From scratch
import numpy as np
import pandas as pd


def atr(high, low, close, period=10):
    prev = close.shift(1)
    tr = pd.concat([high - low, (high - prev).abs(), (low - prev).abs()], axis=1).max(axis=1)
    tr.iloc[0] = high.iloc[0] - low.iloc[0]
    return tr.ewm(alpha=1 / period, adjust=False).mean()


def supertrend(high, low, close, period=10, mult=3.0):
    hl2 = (high + low) / 2
    a = atr(high, low, close, period)
    upper = (hl2 + mult * a).to_numpy()
    lower = (hl2 - mult * a).to_numpy()
    close = close.to_numpy()
    n = len(close)

    st = np.full(n, np.nan)
    direction = np.ones(n, dtype=int)      # +1 up, -1 down
    fu, fl = upper.copy(), lower.copy()

    for i in range(1, n):
        # Band-locking: bands only ratchet in the trend's favour.
        fu[i] = upper[i] if (upper[i] < fu[i - 1] or close[i - 1] > fu[i - 1]) else fu[i - 1]
        fl[i] = lower[i] if (lower[i] > fl[i - 1] or close[i - 1] < fl[i - 1]) else fl[i - 1]

        if st[i - 1] == fu[i - 1]:         # was in downtrend (line = upper)
            st[i] = fl[i] if close[i] > fu[i] else fu[i]
        else:                              # was in uptrend (line = lower)
            st[i] = fu[i] if close[i] < fl[i] else fl[i]
        direction[i] = 1 if st[i] == fl[i] else -1

    return pd.DataFrame({"supertrend": st, "direction": direction})
Read it as a state machine: build the ATR bands, lock them so they only tighten, then flip the active band whenever price closes through it. That’s the ratcheting, side-flipping line from the output chart.
Signals
sup = supertrend(df["high"], df["low"], df["close"])
d = sup["direction"]
df["flip_long"]  = (d == 1) & (d.shift(1) == -1)   # flipped to uptrend
df["flip_short"] = (d == -1) & (d.shift(1) == 1)
flip_long/flip_short are the stop-and-reverse points to
backtest in AlgoGen — ideally with a range filter.
Gotchas
- Band-locking is the whole trick. Without the
fu/flratchet rules the line wobbles and flips constantly. This is the SuperTrend equivalent of the SAR’s prior-bar constraint. - Seeding. The first bar sets the initial band/direction; a few different seeding conventions exist and cause tiny early differences before the line settles.
- Multiplier is the main dial. Bigger = wider, fewer flips; smaller = twitchier. Tune it per instrument.
The lazy one-liner
import pandas_ta as ta
df.ta.supertrend(length=10, multiplier=3.0, append=True)   # adds SUPERT/SUPERTd
Same indicator elsewhere: MQL5, Pine Script, EasyLanguage, NinjaScript.
This post is educational, not financial advice. Indicators describe the past; they don’t predict the future. Backtest anything before you risk real money on it.
Sources and further reading
- Windowing operations (pandas documentation)