Pivot Points are the ultimate “cheap and cheerful” tool: take yesterday’s high, low, and close, do a little arithmetic, and out pop a set of support and resistance lines for today. No lag, no lookback tuning, no smoothing — just levels, computed once, that a huge number of traders watch. Let’s do the math.
The one-sentence job
Pivot Points project support and resistance levels for the current period from the prior period’s high, low, and close. The central pivot is the “fair value” reference; the R (resistance) and S (support) levels above and below mark likely reaction zones.
The formula (standard/floor pivots)
Everything derives from the prior period’s High, Low, and Close:
Pivot (P) = (High + Low + Close) / 3

R1 = 2P − Low          S1 = 2P − High
R2 = P + (High − Low)  S2 = P − (High − Low)
R3 = High + 2(P − Low) S3 = Low − 2(High − P)
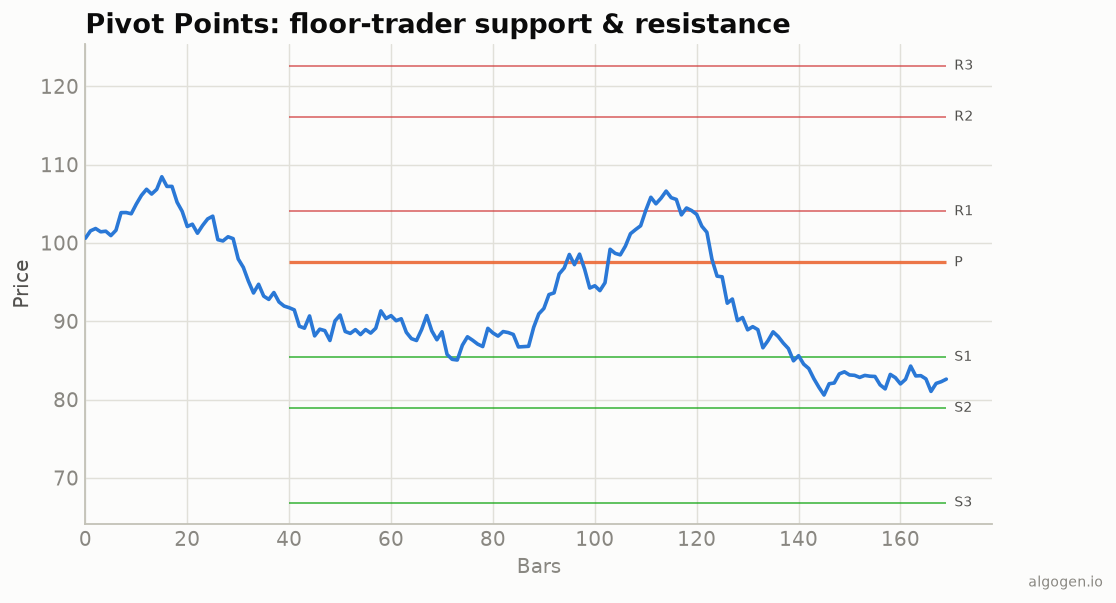
The pivot P is just the prior period’s typical price. R1/S1 are the closest resistance/support, then R2/S2 and R3/S3 step further out. On the chart above, price weaves among these horizontal lines, reacting at them the way pivot traders expect.
Because they’re computed from the prior period and fixed for the current one, pivot lines are flat and known in advance — you can see today’s levels before the session even starts. That’s a big part of their appeal.
How to read it
The pivot as bias. Trading above P suggests a bullish lean for the session; below P, bearish. It’s the day’s dividing line.
R/S as reaction zones. Price approaching R1 may stall or reverse (resistance); approaching S1 may bounce (support). Break cleanly through one and the next level (R2, R3…) becomes the target. Range traders fade the outer levels; breakout traders trade the breaks.
Confluence. Like Fibonacci levels, pivots are strongest where they line up with other evidence — a moving average, a prior swing, a round number.
Why they “work”
Pivot Points are a textbook self-fulfilling tool. There’s nothing magic about
(H+L+C)/3 — but because floor traders, then software, then a generation of day
traders all compute the same levels from the same prior bar, orders cluster at
them, and the levels become real. That’s a legitimate reason to watch them: you’re
watching where everyone else is watching.
The variants
Standard floor pivots are the classic, but there are named cousins with different formulas: Woodie’s pivots (which weight the close more), Camarilla pivots (tighter levels for range trading), Fibonacci pivots (R/S placed at Fib ratios of the range), and DeMark pivots (which vary the calculation based on the open-vs-close relationship). They all share the same idea — project levels from the prior bar — and differ only in the arithmetic.
The timeframes
Daily pivots (from the prior day) are the classic for day trading; weekly and monthly pivots serve swing traders. Match the pivot period to your holding period.
Where it lies to you
- They’re just arithmetic on one bar. Pivots have no predictive power beyond the self-fulfilling clustering; don’t mistake a clean formula for a crystal ball.
- Choppy days ignore them. In a strong trend, price can blow through every level without pausing; in dead chop, it can whipsaw around the pivot meaninglessly.
- Session definition matters. For 24-hour markets (forex, crypto), when the “day” starts changes the levels — different brokers/settings give different pivots.
Pivot Points are a free, zero-lag map of likely support and resistance, watched by enough people to matter. Use them as a framework for where to expect reactions, not as standalone buy/sell signals.
Now go test it, don’t trust it
Do price reactions at pivot levels actually give an edge on your market and session? That’s testable. Build a pivot-bounce or pivot-breakout rule in AlgoGen and measure it. Then compute the levels yourself in Python, MQL5, Pine Script, EasyLanguage, or NinjaScript.
This post is educational, not financial advice. Indicators describe the past; they don’t predict the future. Backtest anything before you risk real money on it.