Most oscillators are trying to measure momentum. The Detrended Price Oscillator (DPO) is doing something genuinely different: it’s trying to erase the trend so you can see the short-term cycles hiding underneath. It’s a niche tool, but for one specific job — spotting the rhythm of peaks and troughs — nothing else does it as cleanly.
The one-sentence job
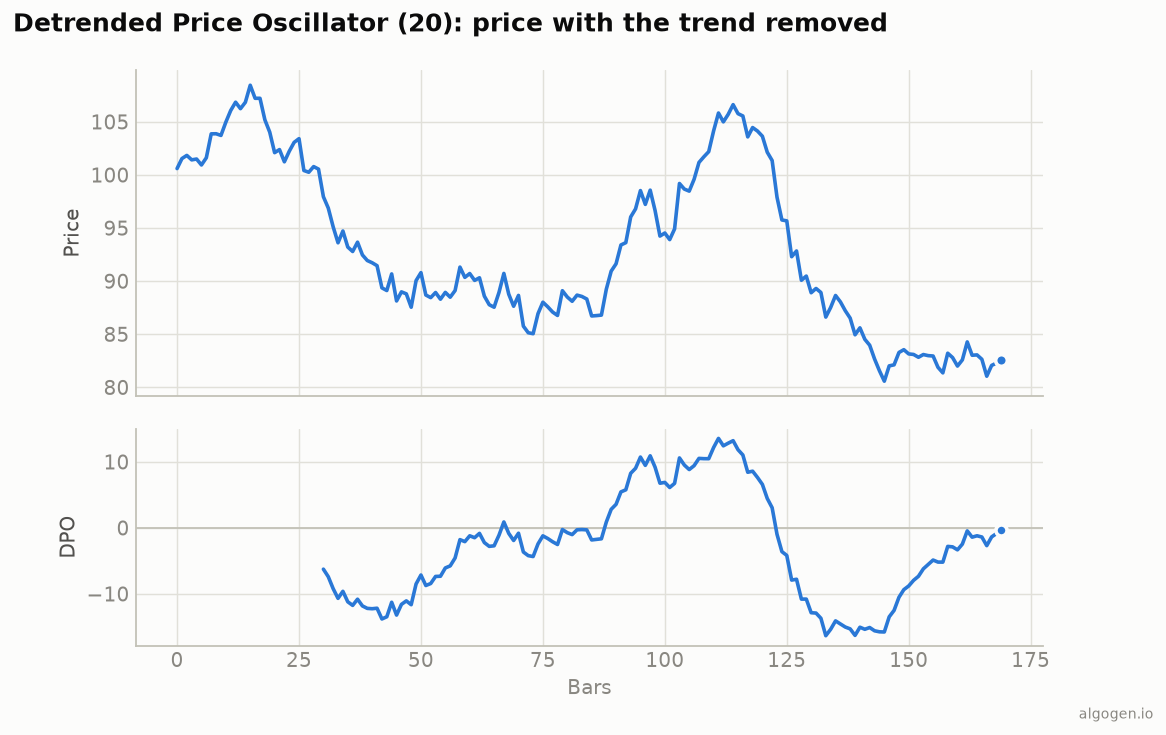
The DPO removes the trend from price by subtracting a moving average that’s been shifted into the past, leaving only price’s oscillation around its own recent mean. What’s left cycles above and below zero, as in the chart above.
The formula
For a lookback of N bars:
1. Compute the N-period simple moving average.
2. Displace that SMA (N/2 + 1) bars into the past.
3. DPO = Close − displaced SMA
For a 20-period DPO, the displacement is 20/2 + 1 = 11 bars. So each bar’s DPO value is
today’s close minus the SMA value from 11 bars ago. That backward shift is the whole
trick — by comparing price to a lagged average rather than the current one, the DPO
lines the average up with the price it’s supposed to represent, and the slow-moving trend
component cancels out.
Why the displacement matters
A normal moving average lags price. If you just subtracted the current SMA from price, you’d get something dominated by that lag. By shifting the SMA back by half its length plus one, the DPO aligns the average with the centre of the data it was built from, so subtracting it removes the trend cleanly and leaves the shorter cycle. That’s the insight: the DPO isn’t price minus an average — it’s price minus a properly aligned average.
How to read it
Cycle spotting. This is the DPO’s real purpose. Measure the distance between successive DPO peaks (or troughs) and you get an estimate of the dominant short-term cycle length. If peaks come every ~20 bars, you’ve found a ~20-bar cycle you can plan around.
Overbought / oversold. Because the trend is gone, extreme DPO readings mark points where price is unusually far above or below its recent mean — a rough overbought/oversold read that isn’t distorted by a strong trend.
Zero line. Crossings show price moving from below to above its detrended mean, but the DPO’s zero-cross is far less useful than its peak-to-peak spacing — read it for rhythm, not for entries.
The one thing to understand: it’s not a momentum indicator
This trips people up constantly. The DPO looks like RSI or the MACD histogram, but it is not measuring momentum, and it is not meant to predict the current trend. Because it uses a displaced average, the most recent bars are handled differently depending on the convention (some platforms don’t even plot the last few bars). The DPO is a backward-looking, cycle-analysis tool. Using its latest value as a real-time buy signal misunderstands what it is.
Centered vs non-centered
There are two display conventions, and they cause a lot of confusion:
- Non-centered (the common default, and what the chart above uses): the DPO is plotted at the current bar, computed as close minus the SMA-from-the-past. Fully real-time-plottable.
- Centered: the DPO is shifted forward and plotted in the past, which centres it on its data but means the last (N/2 + 1) bars are blank. More faithful to the cycle idea, but not usable at the hard right edge.
Know which one your platform uses before you compare charts.
Where it lies to you
- It’s not momentum. Don’t read it like RSI. It answers “where are the cycles,” not “how strong is the move.”
- The right edge is unreliable. Depending on convention, the newest values are either handled specially or not plotted. Never trade the last bar of a DPO.
- Cycles aren’t guaranteed. Markets don’t always have a clean dominant cycle; the DPO will happily show noise as if it were rhythm.
- Displacement depends on N. Change the period and you change both the cycle you’re isolating and the shift — they’re linked.
The DPO is a specialist. For cycle analysis it’s excellent; for anything else, you probably want a different tool.
Now go test it, don’t trust it
Does trading with an estimated cycle — buying near DPO troughs, lightening near peaks — actually work on your instrument? That’s testable, cycle length and all. Build it in AlgoGen. Then compute the DPO yourself in Python, MQL5, Pine Script, EasyLanguage, or NinjaScript.
This post is educational, not financial advice. Indicators describe the past; they don’t predict the future. Backtest anything before you risk real money on it.