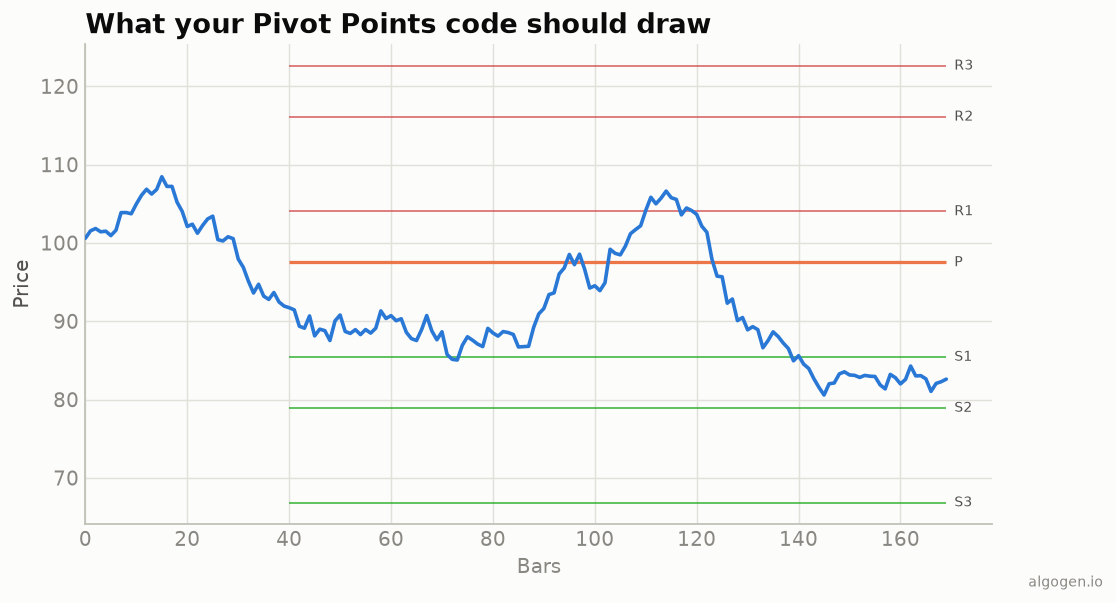
Pivot Points in MQL5 mean pulling the prior day’s high, low, and close and drawing horizontal levels for the current day. See the explainer for the formulas.
What you’ll need
- MetaTrader 5 with MetaEditor
- Save as
AlgoGen.Pivots.mq5underMQL5/Indicators/
The source
//+------------------------------------------------------------------+
//|                                               AlgoGen.Pivots.mq5 |
//|                                          Copyright 2026, AlgoGen |
//|                                           https://www.algogen.io |
//+------------------------------------------------------------------+
#property copyright "Copyright 2026, AlgoGen"
#property link      "https://www.algogen.io"
#property version   "1.00"
#property indicator_chart_window

void DrawLevel(string name, double price, color clr)
  {
   ObjectDelete(0, name);
   ObjectCreate(0, name, OBJ_HLINE, 0, 0, price);
   ObjectSetInteger(0, name, OBJPROP_COLOR, clr);
   ObjectSetString(0, name, OBJPROP_TEXT, name);
  }

int OnCalculate(const int rates_total, const int prev_calculated,
                const datetime &time[], const double &open[],
                const double &high[],   const double &low[],
                const double &close[],  const long &tick_volume[],
                const long &volume[],   const int &spread[])
  {
   // Prior completed daily bar (shift 1 on the D1 timeframe).
   double pH = iHigh(_Symbol, PERIOD_D1, 1);
   double pL = iLow(_Symbol, PERIOD_D1, 1);
   double pC = iClose(_Symbol, PERIOD_D1, 1);
   if(pH == 0 || pL == 0) return(rates_total);

   double P  = (pH + pL + pC) / 3.0;
   double rng = pH - pL;

   DrawLevel("Pivot_P",  P,                    clrOrange);
   DrawLevel("Pivot_R1", 2 * P - pL,           clrIndianRed);
   DrawLevel("Pivot_S1", 2 * P - pH,           clrMediumSeaGreen);
   DrawLevel("Pivot_R2", P + rng,              clrIndianRed);
   DrawLevel("Pivot_S2", P - rng,              clrMediumSeaGreen);
   DrawLevel("Pivot_R3", pH + 2 * (P - pL),    clrIndianRed);
   DrawLevel("Pivot_S3", pL - 2 * (pH - P),    clrMediumSeaGreen);

   return(rates_total);
  }
//+------------------------------------------------------------------+
Install & compile
- Drop it in
MQL5/Indicators/, press F7. - Apply to an intraday chart — the seven pivot levels overlay price as horizontal lines, matching the output chart.
Gotchas
iHigh(..., PERIOD_D1, 1). Shift1is the prior completed daily bar — the correct source. Shift0is today’s still-forming bar (look-ahead).- Redraw, don’t duplicate.
ObjectDeletebeforeObjectCreateeach pass so the lines update in place rather than stacking. - MQL4. Same idea with
iHigh/iLow/iCloseonPERIOD_D1; the object API differs slightly.
Same indicator elsewhere: Python, Pine Script, EasyLanguage, NinjaScript. Then test a pivot rule in AlgoGen.
This post is educational, not financial advice. Indicators describe the past; they don’t predict the future. Backtest anything before you risk real money on it.
Sources and further reading
- Technical indicator functions (MetaQuotes)