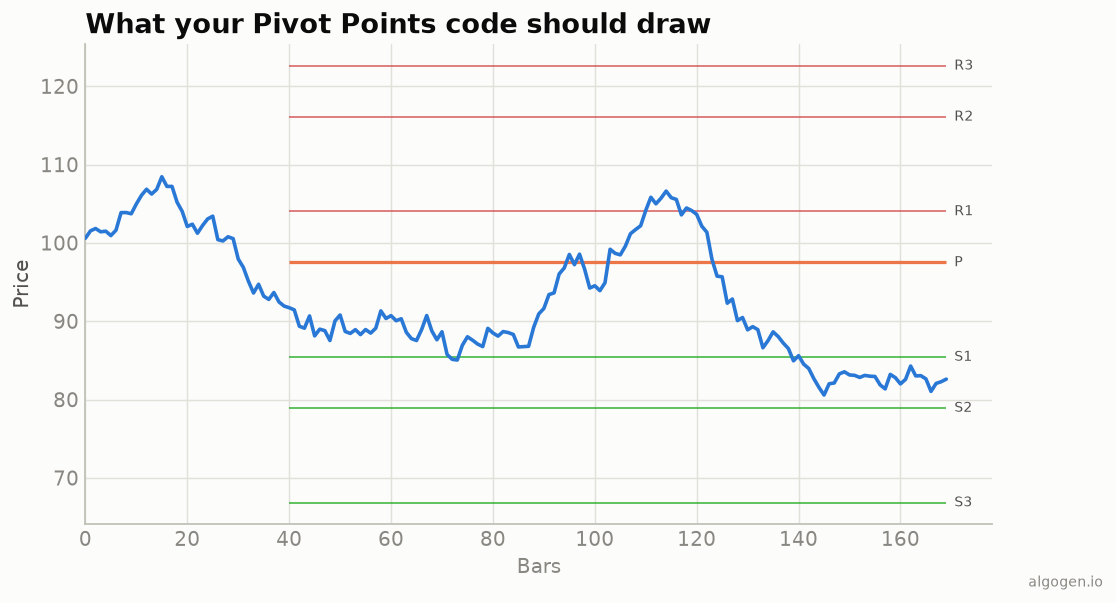
Pivot Points are pure arithmetic on the prior period’s high, low, and close, as the explainer covered. The only real subtlety is sourcing that prior-period bar correctly. Here’s the Python.
What you’ll need
- Python 3.9+,
pandas - OHLC data (with a datetime index for daily pivots on intraday bars).
The seven levels
def pivot_points(high, low, close):
    p = (high + low + close) / 3
    rng = high - low
    return {
        "P": p,
        "R1": 2 * p - low,   "S1": 2 * p - high,
        "R2": p + rng,       "S2": p - rng,
        "R3": high + 2 * (p - low), "S3": low - 2 * (high - p),
    }
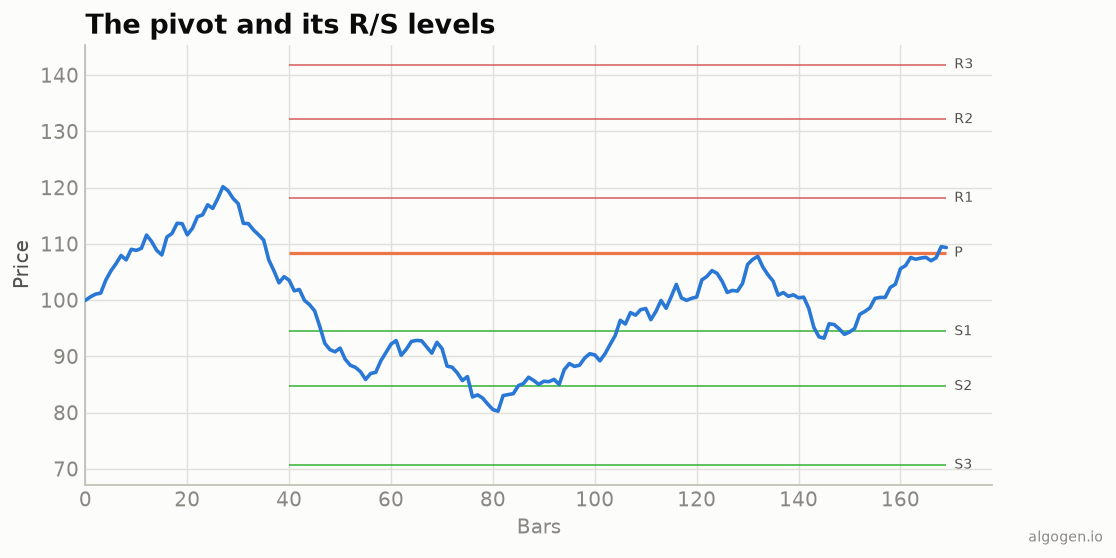
Pass the prior period’s H/L/C and you get today’s levels — the horizontal lines from the output chart.
Sourcing the prior period (daily pivots on intraday data)
The classic case is daily pivots applied to intraday bars: each day’s levels come from yesterday’s daily bar.
daily = df.resample("1D").agg(high=("high", "max"), low=("low", "min"), close=("close", "last")).dropna()
prev = daily.shift(1)                                  # yesterday's bar
lv = pivot_points(prev["high"], prev["low"], prev["close"])
# Map each day's pivot levels back onto the intraday bars of that day as needed.
The shift(1) is essential — today’s pivots use yesterday’s bar, never today’s.
Variants
# Fibonacci pivots: R/S at Fib fractions of the prior range.
def fib_pivots(high, low, close):
    p = (high + low + close) / 3; rng = high - low
    return {"P": p,
            "R1": p + 0.382 * rng, "S1": p - 0.382 * rng,
            "R2": p + 0.618 * rng, "S2": p - 0.618 * rng,
            "R3": p + 1.000 * rng, "S3": p - 1.000 * rng}
Woodie’s, Camarilla, and DeMark variants change the arithmetic similarly.
Gotchas
- Prior period, always. Today’s levels come from yesterday’s bar; using today’s own H/L/C is look-ahead and defeats the purpose.
- Session definition. For 24-hour markets, when the day rolls over changes the levels — pick a session convention and stick to it.
- Levels are fixed for the period. They don’t move intraday; that’s the feature.
Same indicator elsewhere: MQL5, Pine Script, EasyLanguage, NinjaScript. Then test a pivot rule in AlgoGen.
This post is educational, not financial advice. Indicators describe the past; they don’t predict the future. Backtest anything before you risk real money on it.
Sources and further reading
- Windowing operations (pandas documentation)