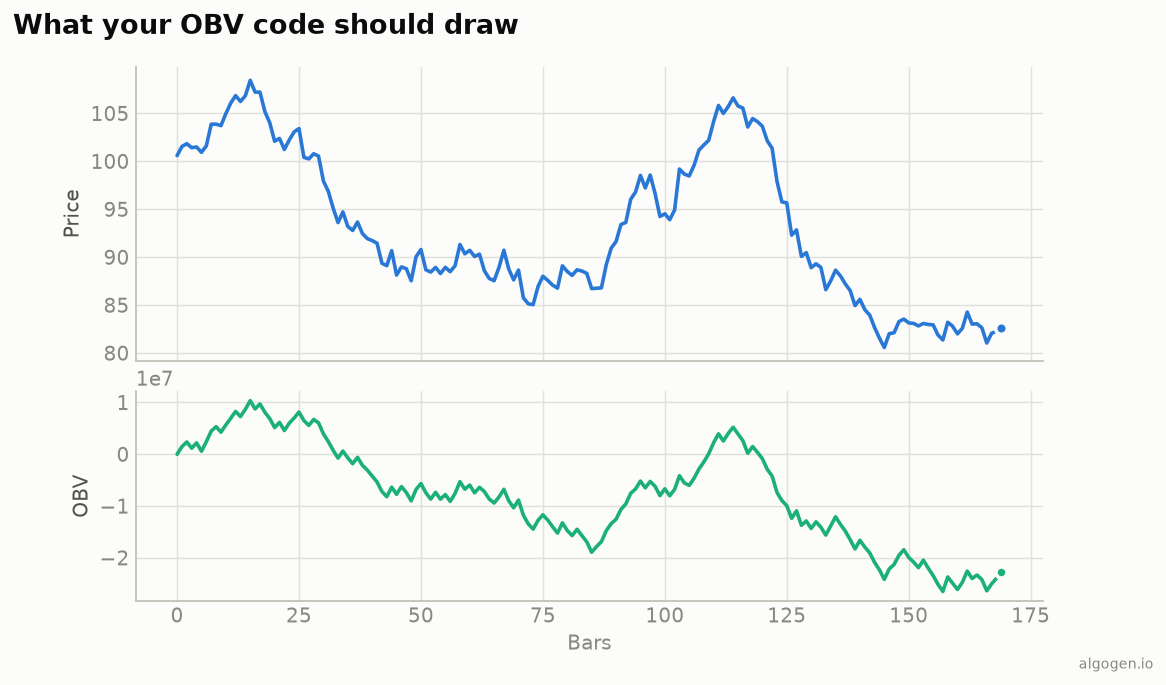
OBV is the most beginner-friendly indicator in this whole series: a running total with an up/down rule, as the explainer covered. In pandas it’s a genuine one-liner once you spot the trick.
What you’ll need
- Python 3.9+,
pandas/numpy closeandvolumeseries.
The vectorized version
The rule “add volume on up closes, subtract on down closes, ignore flat ones” is
exactly sign(price change) × volume, accumulated:
import numpy as np
import pandas as pd


def obv(close: pd.Series, volume: pd.Series) -> pd.Series:
    direction = np.sign(close.diff()).fillna(0)   # +1 up, -1 down, 0 flat/first bar
    return (direction * volume).cumsum().rename("obv")
np.sign(close.diff()) gives +1/−1/0 per bar, multiplying by volume applies the
sign, and cumsum() accumulates it into the running total from the chart above.
No loop needed.
Reading it in code: divergence
Since the OBV level is meaningless, you compare its slope to price’s. A crude but illustrative divergence check:
obv_line = obv(df["close"], df["volume"])
win = 20
price_up = df["close"] > df["close"].shift(win)
obv_down = obv_line < obv_line.shift(win)
df["bearish_divergence"] = price_up & obv_down   # price up, volume flow down
That flags spots where price rose over the window but OBV fell — a classic distribution warning to test in AlgoGen.
Gotchas
- The first bar.
close.diff()is NaN on bar 0;fillna(0)keeps it out of the sum so OBV starts flat. - Exactly-flat closes.
np.sign(0)is 0, so unchanged closes correctly leave OBV untouched — matching Granville’s rule. - Absolute value is noise. Only compare OBV’s direction to price. Never threshold on the raw OBV number; it depends on your arbitrary start point.
- Starting value. We start at 0. Some platforms seed with the first bar’s volume; it shifts the whole line by a constant and changes nothing that matters.
An OBV signal line
Since the raw level is arbitrary, a common practical move is to smooth OBV and trade the crossover — turning a directionless total into discrete signals:
obv_line = obv(df["close"], df["volume"])
obv_ma = obv_line.rolling(20).mean()
df["obv_bull"] = (obv_line > obv_ma) & (obv_line.shift(1) <= obv_ma.shift(1))
obv_bull fires when OBV crosses above its own 20-period average — a cleaner,
more testable event than eyeballing the slope, and a good companion to the
divergence check above.
The lazy one-liner
import pandas_ta as ta
df["obv"] = ta.obv(df["close"], df["volume"])
Same indicator elsewhere: MQL5, Pine Script, EasyLanguage, NinjaScript.
This post is educational, not financial advice. Indicators describe the past; they don’t predict the future. Backtest anything before you risk real money on it.
Sources and further reading
- New Key to Stock Market Profits (Google Books)
- Windowing operations (pandas documentation)