Price tells you what happened. Volume tells you how much conviction was behind it. On-Balance Volume is one of the oldest and simplest ways to fold volume into a single line, and its whole philosophy fits in four words: volume precedes price. Whether or not you buy that claim, OBV is trivially simple to compute and genuinely useful as a confirmation tool. Let’s do the math.
The one-sentence job
OBV keeps a running total of volume, adding the day’s volume when price closes up and subtracting it when price closes down. The result is a cumulative line whose direction tells you whether volume is flowing into or out of an instrument.
The formula
There’s no smoothing, no period, no parameter — just a running sum with a rule:
If Close > Previous Close:   OBV = Previous OBV + Volume
If Close < Previous Close:   OBV = Previous OBV − Volume
If Close = Previous Close:   OBV = Previous OBV        (unchanged)
That’s it. Up day, add all of today’s volume; down day, subtract all of it; flat day, leave it alone. The starting value is arbitrary (usually zero), which leads to the single most important thing to understand about OBV.
A quick worked example
Start OBV at 0. Say volumes are 1,000 / 1,500 / 800 / 2,000 over four days, and price closes up, up, down, up:
Day 1: up   → OBV = 0 + 1,000     = 1,000
Day 2: up   → OBV = 1,000 + 1,500 = 2,500
Day 3: down → OBV = 2,500 − 800   = 1,700
Day 4: up   → OBV = 1,700 + 2,000 = 3,700
Notice the OBV rose strongly on the big up-days and only dipped modestly on the low-volume down-day — that’s the line “telling you” buying volume dominated. The number 3,700 means nothing on its own; the rising shape is the message.
The absolute number is meaningless
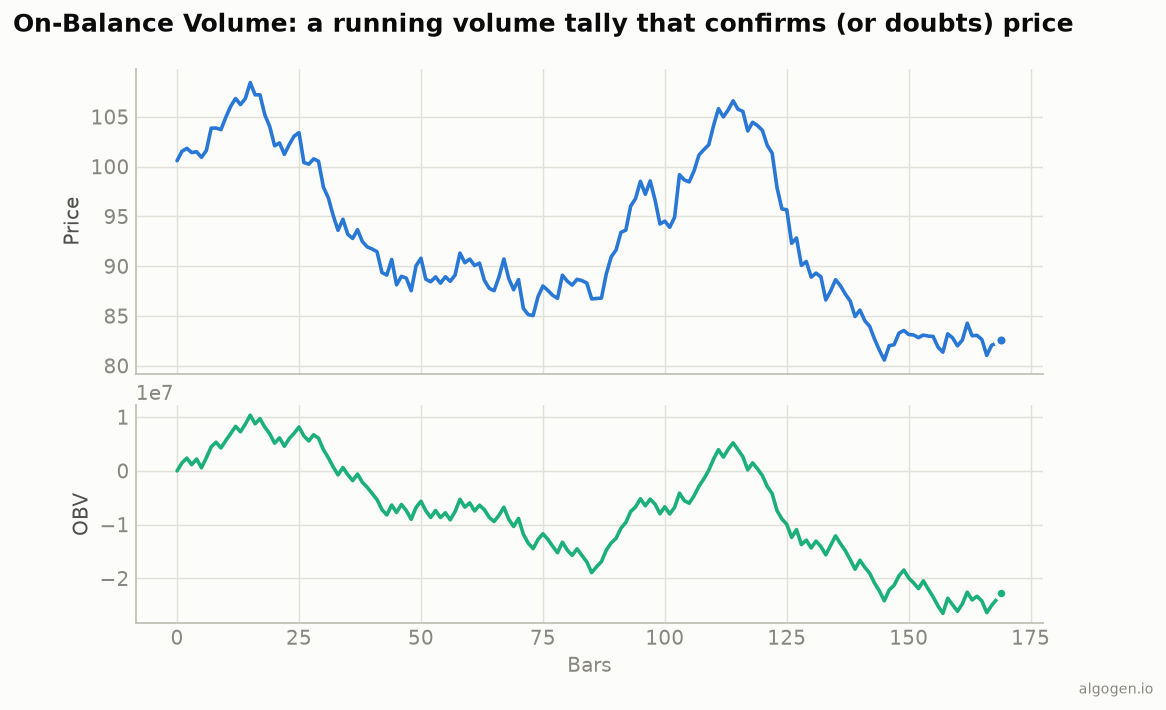
Because OBV is a running total from an arbitrary start, the actual value — “OBV is 4.2 million” — tells you nothing. What matters is the direction and shape of the line, and how it compares to price. Never read the OBV level; read its trend. On the chart above, watch how the OBV line (aqua) rises and falls with price when volume is confirming the move.
How to read it
Confirmation. In a healthy uptrend, OBV should be making higher highs right along with price — volume is supporting the advance. In a downtrend, OBV should be falling with price. When OBV and price move together, the move has volume behind it.
Divergence. This is where OBV earns its keep. If price is drifting sideways or even making new highs, but OBV is quietly rising faster (or falling), that hints at accumulation or distribution happening beneath the surface — big players building or dumping positions before the price fully reflects it. Granville’s core claim was exactly this: OBV often turns before price does. A rising OBV under a flat price is a bullish tell; a falling OBV under a rising price is a warning.
Breakouts. Some traders watch for OBV to break its own trendline as an early signal that price may follow.
Where it lies to you
- It’s binary about price. OBV adds the entire day’s volume whether price closed up by a penny or by ten percent. A tiny up-close and a massive up-close are treated identically, which throws away information. (Indicators like the Accumulation/Distribution line try to fix this by weighting volume by where price closed in its range.)
- One huge day distorts it. A single enormous-volume session can dominate the line for a long time.
- “Volume precedes price” isn’t a law. Divergences can persist or resolve the “wrong” way. OBV is a hint, not a guarantee.
- Gaps and flat closes. Exactly-equal closes leave OBV unchanged, which is rare intraday but a defined edge case.
OBV is refreshingly honest about what it is: a cumulative vote-counter for volume. Used to confirm trends and spot divergences, it’s a valuable second opinion alongside price. Used as a standalone buy/sell trigger, it’s far too blunt.
Now go test it, don’t trust it
Does OBV divergence actually precede price moves on the thing you trade? That’s a testable question. Build an OBV-divergence filter in AlgoGen and see whether it improves your entries. Then build OBV yourself in Python, MQL5, Pine Script, EasyLanguage, or NinjaScript.
This post is educational, not financial advice. Indicators describe the past; they don’t predict the future. Backtest anything before you risk real money on it.
Sources and further reading
- New Key to Stock Market Profits (Google Books)