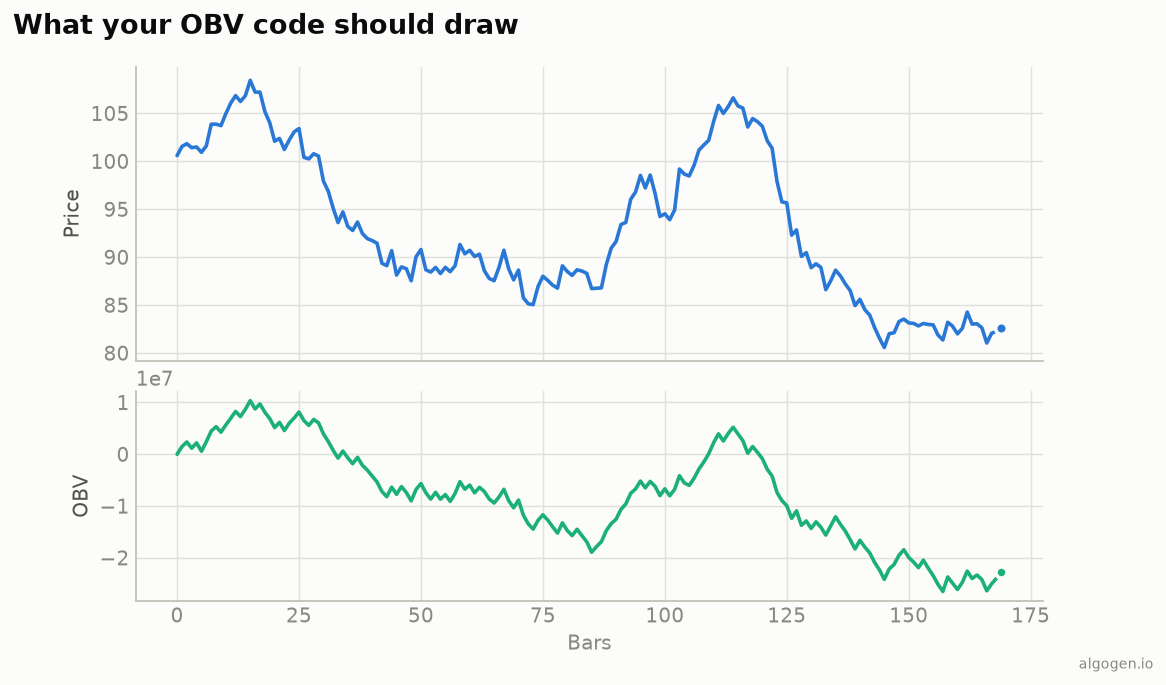
EasyLanguage has On-Balance Volume built in as the OBV reserved word, and
building it by hand is a clean lesson in accumulating a value across bars. See
the explainer for Granville’s rule.
What you’ll need
- TradeStation or MultiCharts
- The EasyLanguage / PowerLanguage Editor, new Indicator
The built-in version
{ AlgoGen OBV — TradeStation / MultiCharts }
inputs:
    MALen( 20 );

variables:
    OBVval( 0 ),
    OBVavg( 0 );

OBVval = OBV;                       { built-in running On-Balance Volume }
OBVavg = Average( OBVval, MALen );  { signal line }

Plot1( OBVval, "OBV" );
Plot2( OBVavg, "OBV MA" );
OBV is a reserved word that returns the running On-Balance Volume directly, and
averaging it gives a signal line for crossovers — the aqua/orange pair from the
output chart.
The from-scratch version
To see the accumulation explicitly:
{ AlgoGen OBV (manual) }
variables: OBVval( 0 );

if CurrentBar = 1 then
    OBVval = Volume
else if Close > Close[1] then
    OBVval = OBVval[1] + Volume
else if Close < Close[1] then
    OBVval = OBVval[1] - Volume
else
    OBVval = OBVval[1];

Plot1( OBVval, "OBV" );
OBVval[1] reads the prior bar’s value, so each bar builds on the last — the
essence of a cumulative indicator.
An OBV/MA crossover strategy
Because trading the raw level is meaningless, here’s the crossover as a Strategy:
{ AlgoGen OBV Cross — Strategy }
inputs: MALen( 20 );
variables: OBVval( 0 ), OBVavg( 0 );

OBVval = OBV;
OBVavg = Average( OBVval, MALen );

if OBVval crosses over OBVavg then Buy next bar at market
else if OBVval crosses under OBVavg then Sell next bar at market;
It’s a blunt instrument on its own — but combined with a price-trend filter it’s a reasonable way to test whether “volume-flow turning up” adds anything to your entries. The Strategy Performance Report will tell you.
Gotchas
VolumevsTicks. In EasyLanguage,Volumereturns share/contract volume on daily+ data but tick count on intraday bars unless configured otherwise. UseTicksexplicitly if you want tick volume, and know which one you’re feeding OBV.- Signal, not level. Plot an average of OBV to get tradeable crossovers; the raw level is arbitrary.
- Seeding. The manual version seeds bar 1 with
Volume; the built-inOBVmay seed at zero. It only shifts the line by a constant.
Same indicator elsewhere: Python, MQL5, Pine Script, NinjaScript. Then backtest an OBV rule in AlgoGen.
This post is educational, not financial advice. Indicators describe the past; they don’t predict the future. Backtest anything before you risk real money on it.
Sources and further reading
- New Key to Stock Market Profits (Google Books)
- What is EasyLanguage? (TradeStation)