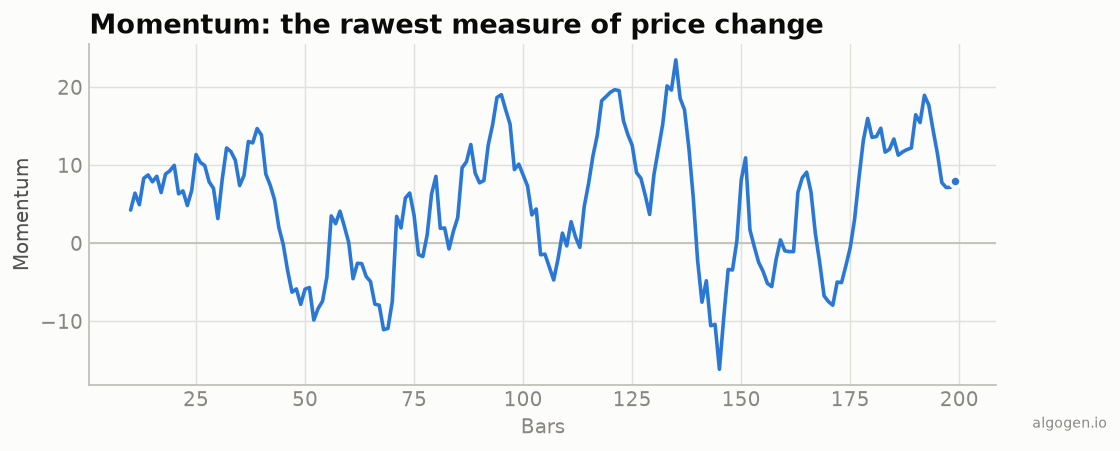
The Momentum indicator shares a trait with its percentage cousin, the Rate of Change: it has no single inventor, because it’s too fundamental to have one. “Today’s price minus an earlier price” is subtraction, and nobody patents subtraction. But the idea of momentum has a surprisingly grand intellectual history — one that runs from a borrowed physics metaphor all the way to a landmark academic paper.
A metaphor from physics
The word “momentum” is lifted straight from physics, where it describes a moving object’s tendency to keep moving. Applied to markets, the metaphor is intuitive: a price that’s been rising tends, for a while, to keep rising; a falling one keeps falling. Traders have leaned on that intuition for as long as there have been price records, and the simplest way to quantify it — subtract a past price from the present one — needs no formula-namer. It appears in early technical-analysis writing as a primitive, presented rather than attributed.
The building block
Momentum’s real historical role is as the atom from which bigger indicators are assembled. The MACD is momentum in spirit; the TRIX is momentum of a triple-smoothed line; the ROC is momentum expressed as a percentage; countless “custom” oscillators are momentum with a moving average on top. When you understand this one-line primitive, you’ve understood the seed of a whole family tree — which is why textbooks introduce it early and briefly.
Where it got serious: academic momentum
Here’s where the humble indicator connects to something bigger. Separate from the chart tool, academic finance documented a momentum effect — the empirical tendency of assets that have recently outperformed to keep outperforming (and losers to keep losing) over intermediate horizons. The landmark study by Narasimhan Jegadeesh and Sheridan Titman, published in 1993, showed this “relative strength” momentum earned abnormal returns across stocks, and it became one of the most robust, widely-replicated anomalies in all of finance — a genuine headache for the efficient-market view.
That academic momentum is cross-sectional (ranking many assets against each other), which is different from the time-series Momentum indicator on a single chart. But they spring from the same seed: recent performance carries information about near-future performance. The chart indicator is the folk version; the academic finding is its rigorously-tested sibling — and momentum’s status as a real, persistent market phenomenon is a big part of why the indicator has never gone out of style.
Momentum becomes a “factor”
Academic momentum didn’t stay a curiosity — it became a cornerstone of modern factor investing. In 1997, Mark Carhart added a momentum factor (often labeled “UMD,” up-minus-down) to the Fama-French model, creating the widely-used four-factor model for evaluating fund performance. Momentum took its place alongside value and size as one of the handful of factors that seem to explain returns across markets and decades — a striking outcome for something a chartist would recognize as “buy what’s been going up.”
But momentum has a dark side worth knowing: momentum crashes. Because momentum strategies pile into recent winners, they can suffer sudden, brutal reversals when the market violently rotates — as it did coming out of the 2009 bottom, when beaten-down “loser” stocks rocketed and momentum portfolios were caught badly offside. Researchers like Daniel and Moskowitz documented these crashes in detail. The lesson mirrors what chart traders learn with the indicator: momentum works until it very much doesn’t, and managing the reversal risk is the whole game.
Why it endured
Momentum endured for the most basic reason imaginable: it measures something real and does it in the simplest way possible, with nothing to sell or brand. It became a primitive that every other momentum tool builds on, and its underlying premise earned decades of academic support. You can implement it in a single line — which is exactly what we do in the implementation posts.
This post is educational, not financial advice. Indicators describe the past; they don’t predict the future. Backtest anything before you risk real money on it.