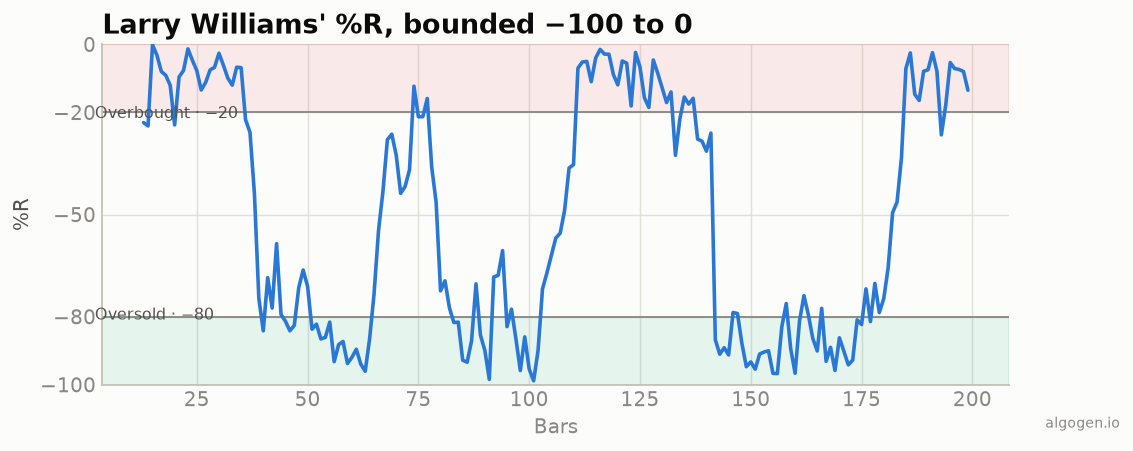
Most indicator creators are remembered only by the tool that carries their name. Larry Williams is the rare exception whose trading is as famous as his indicator — thanks to one of the most jaw-dropping results in the history of public trading competitions. And the oscillator that bears his name, Williams %R, has been quietly riding along on every chart platform for decades.
The 1966 idea, the 1973 reveal
Larry Williams began trading stocks, futures, and commodities in 1966, and it was around then that he developed the oscillator now known as Williams %R. Like several of his contemporaries, he was chasing a way to measure momentum by asking where the current close sat within its recent trading range — a question that several people were circling independently in that era (see the stochastic history for the parallel work of George Lane’s group). Williams kept %R as part of his own toolkit for years before making it public in his 1973 writing, at which point it entered the wider technical- analysis vocabulary.
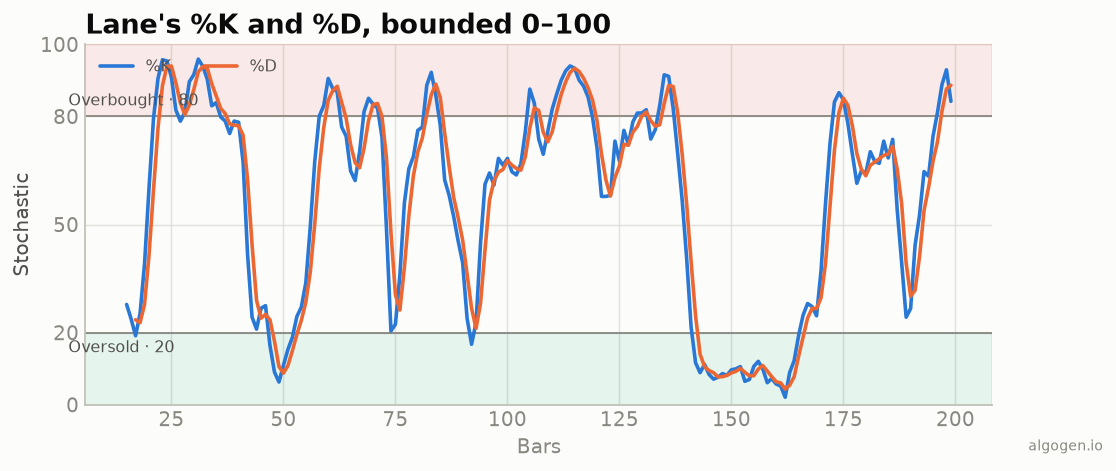
The design goal was simple and pragmatic: normalize “closing strength” onto a bounded scale so it could be compared across markets and time. His choice to anchor the measure to the high of the range (and use a negative scale) is what distinguishes it cosmetically from the stochastic — the two are, mathematically, mirror images.
The 1987 World Cup
Here’s the story that made Larry Williams a legend. In 1987, he entered the Robbins World Cup Championship of Futures Trading — a real-money trading contest — and grew a $10,000 account to over $1.1 million in twelve months, a return of roughly 11,300%. It remains one of the most cited results in trading- competition history. (It’s also frequently invoked as a caution: returns like that require enormous risk, and Williams himself has been candid that the account saw large drawdowns along the way. Spectacular compounding cuts both directions.)
The performance turned Williams into a prominent public figure in trading education — a prolific author and seminar speaker for decades. As a well-known aside, his daughter is the actress Michelle Williams; trading and Hollywood don’t often share a family tree.
Not his only contribution
Williams %R is the tool with his name on it, but Larry Williams left a broader mark on technical analysis. He created the Ultimate Oscillator (a later cluster in this series), which blends three timeframes to reduce the false divergences that plague single-period oscillators. He was also a tireless popularizer of Commitment of Traders (COT) analysis — reading the weekly positioning reports of commercial hedgers versus speculators to gauge where “smart money” sits. Across books, courses, and decades of seminars, he pushed the idea that ordinary traders could use published data and simple, well-defined tools to compete. Whatever one makes of the eye-watering contest returns, that democratizing streak is genuinely in the spirit of building your own tools rather than renting someone’s black box.
Why %R stuck around
Williams %R endured for the same unglamorous reasons as the rest of this series’ classics: it’s simple, bounded, and trivial to compute — just a couple of subtractions and a division against the recent high-low range. When charting software spread, it was effortless to include, and it rode Larry Williams’ considerable fame into every platform’s indicator menu.
It’s worth being honest that %R offers little that the stochastic doesn’t; they’re close cousins measuring the same thing. But that redundancy is itself a useful history lesson: in the 1960s and 70s, several sharp traders independently arrived at “where’s the close in the range?” as a momentum measure, and the market kept more than one version of essentially the same good idea. Larry Williams’ name happened to be attached to one of them — and the name of a trader who turned ten grand into a million is a name that sells.
Like everything here, the math is yours for free: %R is one formula you can rebuild in any language, which is what we do in the implementation posts.
This post is educational, not financial advice. Indicators describe the past; they don’t predict the future. Backtest anything before you risk real money on it.
Sources and further reading
- Larry Williams' indicator chronology (I Really Trade)
- World Cup Trading Championship historical standings (World Cup Trading Championships)