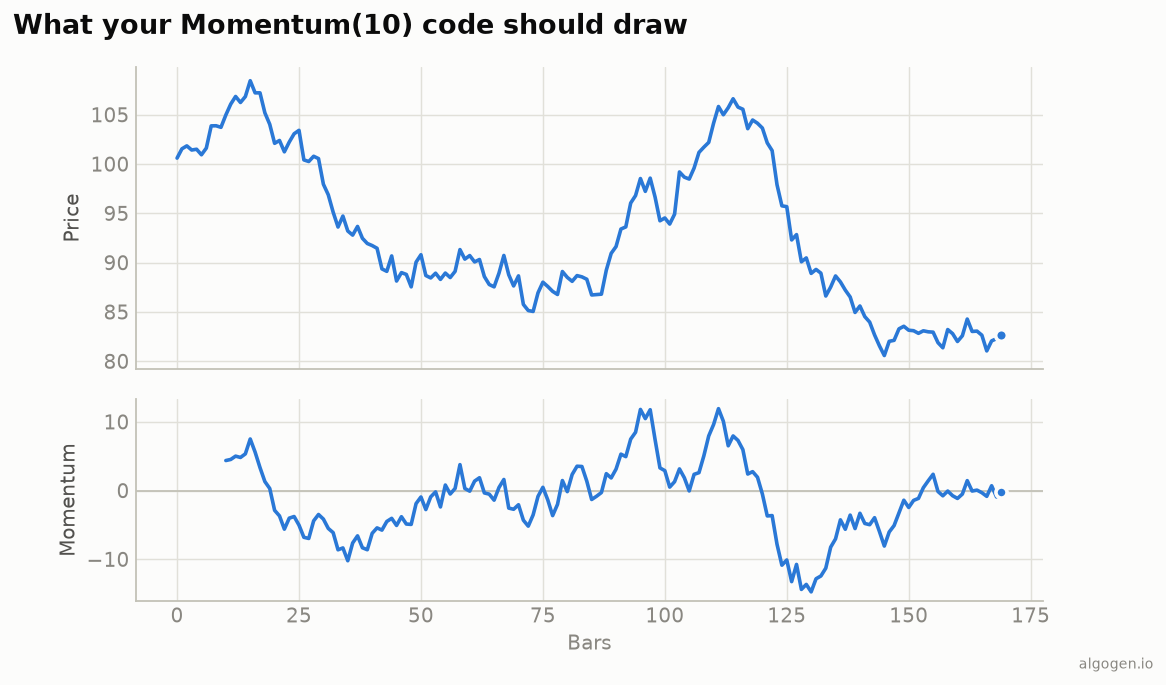
Momentum is the shortest possible indicator: subtract a past price from the present one. The explainer covers the concept; here it is in pandas, both the difference and ratio forms.
What you’ll need
- Python 3.9+,
pandas - A
closeseries.
The difference form (classic)
def momentum(close, period: int = 10):
    return close - close.shift(period)
Positive above zero, negative below — the oscillator from the output chart. That’s genuinely the whole thing.
The ratio form (100-centered)
Some platforms (MetaTrader among them) use the ratio version, which oscillates around 100:
def momentum_ratio(close, period: int = 10):
    return 100 * close / close.shift(period)
Above 100 = price higher than N bars ago; below 100 = lower. Same information, shifted scale — know which one your platform draws before comparing.
Momentum vs ROC
They differ by one operation — Momentum is absolute, ROC is percentage:
mom = close - close.shift(10)                 # points
roc = 100 * (close - close.shift(10)) / close.shift(10)   # percent
Use ROC when comparing across instruments; use Momentum when raw point-change on one instrument is what you want.
Smoothing and signals
mom = momentum(df["close"], 10)
mom_smooth = mom.rolling(3).mean()            # calm the noise
above = mom > 0
df["mom_bull"] = above & ~above.shift(1, fill_value=False)   # crossed above zero
mom_bull is a clean zero-cross signal to backtest in AlgoGen,
ideally behind a trend filter since Momentum has no fixed levels.
Gotchas
- Absolute, not percentage. Momentum’s raw points aren’t comparable across markets — reach for ROC if you need comparability.
- Difference vs ratio. Around zero (difference) or around 100 (ratio). Don’t mix them up when reading signals.
- No fixed levels; noisy. Judge extremes relative to recent range, and smooth if the raw line is too jumpy.
Bonus: cross-sectional momentum
The chart indicator is time-series momentum. Its famous cousin, cross-sectional momentum, ranks many instruments by recent return and buys the leaders — a few lines across a DataFrame of prices:
# prices: DataFrame, one column per instrument.
lookback = 126                       # ~6 months of daily bars
returns = prices / prices.shift(lookback) - 1
ranks = returns.rank(axis=1, ascending=False)
longs = ranks <= 5                   # top-5 momentum names each day
This is the shape of the momentum factor from the history — the same “recent strength persists” intuition, applied across a universe rather than one chart.
The lazy one-liner
import pandas_ta as ta
df["mom10"] = ta.mom(df["close"], length=10)   # difference form
Same indicator elsewhere: MQL5, Pine Script, EasyLanguage, NinjaScript.
This post is educational, not financial advice. Indicators describe the past; they don’t predict the future. Backtest anything before you risk real money on it.
Sources and further reading
- Windowing operations (pandas documentation)