The Commodity Channel Index has a name that actively misleads people. It suggests a niche tool for grain and oil traders, when in fact it’s a general-purpose oscillator used across every asset class. The name is a historical accident of where and why it was first published — and the story is a tidy example of how an indicator’s origins get baked into its branding forever.
A mathematician in a trade magazine
The CCI was created by Donald Lambert, and it was introduced to the world in the October 1980 issue of Commodities magazine — the publication that later became Futures magazine. Lambert approached the problem as a mathematician, and it shows in the formula: the deliberate use of mean absolute deviation, and especially the carefully chosen scaling constant, reflect someone thinking statistically about how to make an oscillator’s levels mean something.
Why “commodity”
Lambert designed the tool specifically to identify cyclical turns in commodity futures. Commodities often move in seasonal or cyclical rhythms — crops, energy, metals all have their patterns — and Lambert wanted a way to detect when a commodity was entering a new cyclical up- or down-swing. He built the index to flag those cyclical extremes, and since it was published in a commodities magazine for commodities traders, “Commodity Channel Index” was a perfectly natural name.
The irony is that the math doesn’t care what it’s measuring. Because CCI is just “how far is price from its average, in units of typical deviation,” it works exactly as well on a tech stock or a currency pair as on soybeans. Traders quickly realized this, and today CCI is applied everywhere — the “commodity” in the name is a fossil of its birthplace, nothing more.
The clever constant
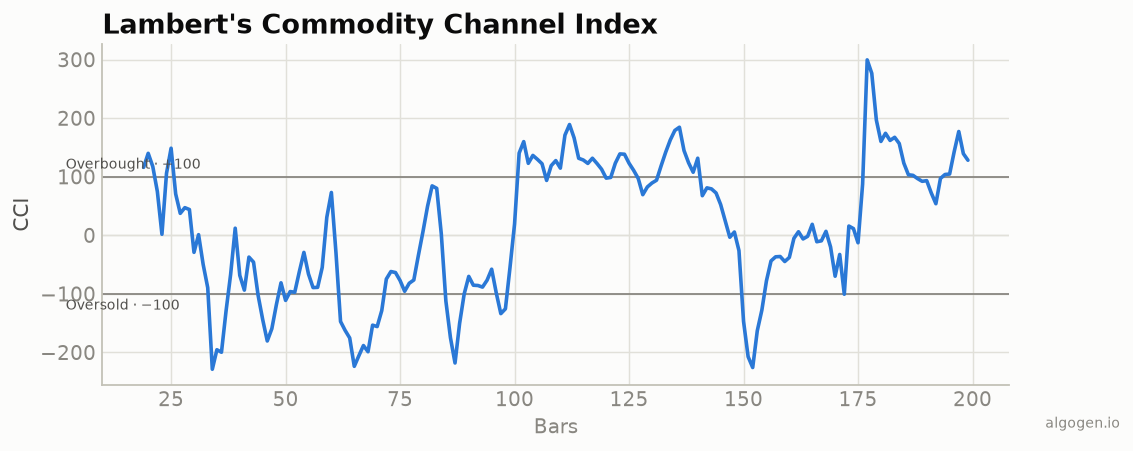
The detail that best captures Lambert’s mathematical bent is the 0.015 constant in the denominator. It’s not a fudge factor — he chose it so that roughly 70 to 80 percent of CCI readings would land between −100 and +100. That calibration is what makes the ±100 levels useful: cross them and you’re in the statistically unusual minority of readings, which is exactly the “cyclical extreme” Lambert was hunting for. Baking the interpretation into the scaling was an elegant move, and it’s why CCI’s ±100 levels carry real meaning rather than being arbitrary round numbers.
Reversal or breakout?
There’s a genuine historical nuance worth knowing. Lambert’s original framing leaned toward using CCI to catch the start of strong moves — a push above +100 signaling an emerging up-trend to trade with. Over the decades, though, a large camp of traders adopted the opposite, mean-reversion reading, fading +100 as “overbought.” Both camps cite CCI as their own. That split isn’t a flaw so much as a reflection of how a well-made oscillator can serve different strategies in different regimes — but it does mean “what CCI says” depends heavily on who’s reading it.
A system grows up around it
CCI’s flexibility spawned whole trading systems built specifically on it. The best known is Woodies CCI, a methodology popularized by trader Ken Wood that uses a fast and slow CCI, patterns with names like the “zero-line reject” and “trend line break,” and a dedicated on-chart panel. Whatever one thinks of any particular system, the fact that CCI became the centerpiece of a following — rather than just one line among many — speaks to how much information traders felt they could wring out of Lambert’s simple deviation measure. It’s a recurring theme in this series: a clean, well-calibrated formula tends to attract a community that builds far more on top of it than the inventor ever specified.
Why it endured
CCI survived and spread for the familiar reasons: it’s well-defined, cheaply computed, and genuinely useful, with the bonus of a statistically-calibrated scale that gives its levels real meaning. When charting software arrived, it was trivial to include, and its misleading-but-memorable name traveled with it onto every platform.
And, as always in this series, there’s no secret sauce to buy: CCI is a typical price, a moving average, a mean absolute deviation, and one clever constant. You can build Lambert’s exact 1980 tool in a few lines, which is what we do in the implementation posts.
This post is educational, not financial advice. Indicators describe the past; they don’t predict the future. Backtest anything before you risk real money on it.