Some indicators are ancient ideas reinvented by committee. The MACD is not one of those. It has a clear author, a clear date, and a clear second act — which makes its history unusually tidy for a tool this famous. It’s also a great reminder that most “revolutionary” indicators are just clever recombinations of things that already existed, built by working traders who wanted a better read on the market.
Gerald Appel builds it
The MACD was created by Gerald Appel in the late 1970s — he developed it around 1977 and published the original write-up in 1979. Appel wasn’t an academic; he was a money manager and technical analyst who ran an investment advisory firm and wrote prolifically for other traders. He was after a practical problem: moving averages were useful for spotting trends but slow and awkward to watch, and a single average told you direction but not much about momentum — whether a trend was gathering steam or running out of it.
Appel spread his ideas through his advisory firm, Signalert Corporation, and a long-running market newsletter, Systems and Forecasts, and later through widely-read books on technical trading. He was, in other words, exactly the kind of practitioner-communicator who gets an indicator adopted: someone with a real track record who could also explain the tool plainly to other traders.
His insight was elegantly cheap. Instead of staring at two moving averages and eyeballing the gap between them, why not just plot the gap itself? Subtract a slow exponential moving average from a fast one and you get a single line that rises when the averages spread apart (momentum building) and falls when they converge (momentum fading). Add a moving average of that line — the “signal” line — and you have a built-in trigger for when momentum shifts. The name is almost a literal instruction manual: Moving Average Convergence Divergence, describing the two averages coming together and moving apart.
Why 12, 26, and 9?
The default settings — a 12-period fast EMA, a 26-period slow EMA, and a 9-period signal — trace back to when the stock market traded six days a week. In that world, 12 periods was roughly two weeks of trading and 26 was roughly a month, with 9 about a week and a half for the signal. The six-day trading week is long gone, but the numbers never changed. Like the RSI’s 14, they’re a convention with so much gravity that every platform still ships them by default, and so many traders watch them that they take on a mild self-fulfilling quality.
Thomas Aspray adds the histogram
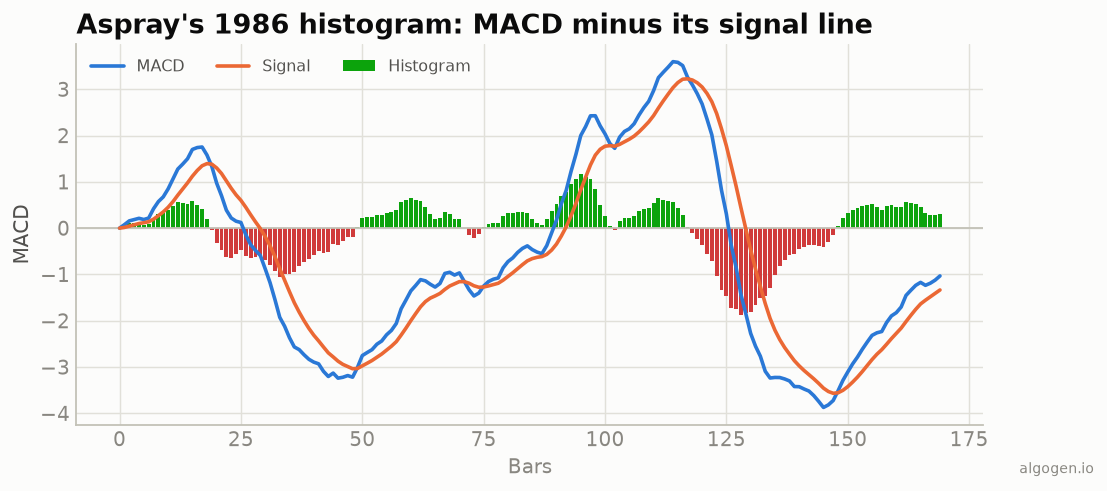
Appel’s original MACD was the two lines. The histogram — the bars that are probably the first thing you notice on a modern MACD — came later. In 1986, Thomas Aspray added the histogram, plotting the difference between the MACD line and its signal line as vertical bars. The reason was timing: by the time the MACD line actually crosses its signal line, a good chunk of the move can already be over. The histogram shrinks toward zero before that crossover happens, so it gives an earlier, more visual heads-up that momentum is fading. Aspray’s addition was popular enough that today many people think of the histogram as the MACD, even though it’s a decade-younger bolt-on.
How it took over
The MACD had everything going for it as charting software spread through the 1980s and 1990s. It was defined by a simple, deterministic formula that computers loved. It produced a clean, readable picture in its own panel. It gave several kinds of signals — zero crosses, signal crosses, histogram shifts, divergence — so it appealed to traders of different styles. And it had a memorable, official name attached to a real author, which lent it credibility.
The result is that the MACD is now one of the two or three most recognized indicators on earth, sitting in the default toolset of every platform from free web charts to institutional terminals. Not bad for “subtract one average from another.” And, true to the spirit of this whole series: nobody owns the formula, so you can build the exact tool Appel and Aspray created in an afternoon — which is precisely what we do in the implementation posts.
This post is educational, not financial advice. Indicators describe the past; they don’t predict the future. Backtest anything before you risk real money on it.
Sources and further reading
- Gerald Appel (CMT Association)