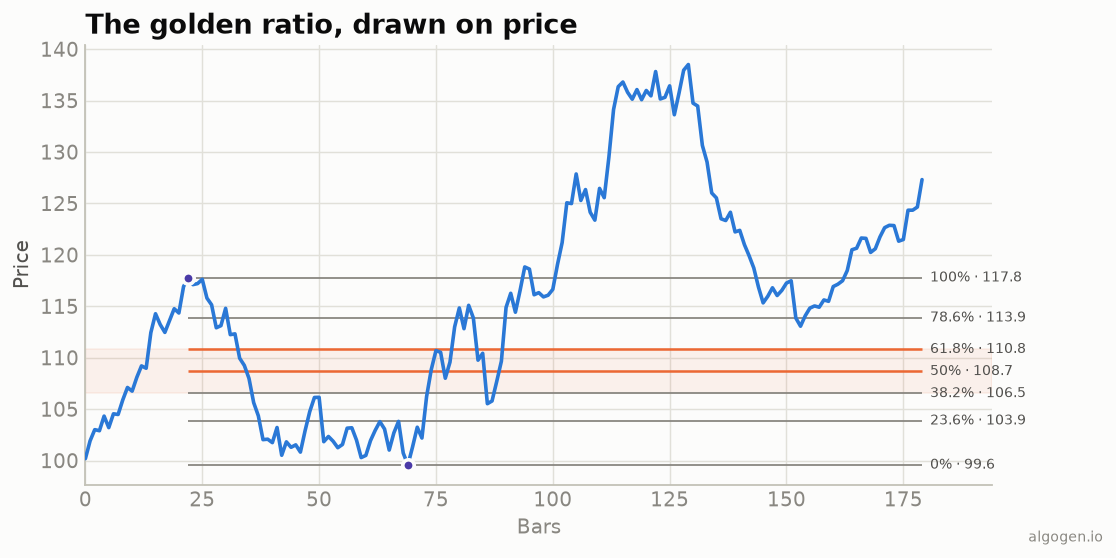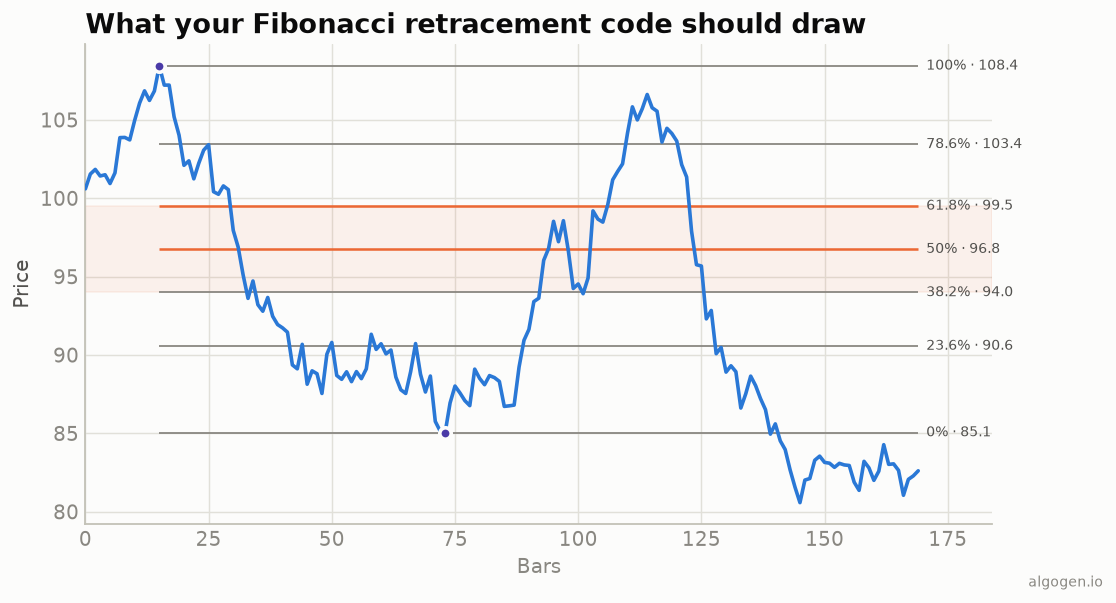
MetaTrader has a manual Fibonacci tool, but the interesting exercise is
auto-drawing the levels from a rule-based swing so it’s not eyeballed. MQL5’s
OBJ_FIBO object does the level math for you once you give it two anchor points.
See the explainer for the concept.
What you’ll need
- MetaTrader 5 with MetaEditor
- Save as
AlgoGen.Fibo.mq5underMQL5/Indicators/
The source
//+------------------------------------------------------------------+
//|                                                 AlgoGen.Fibo.mq5 |
//|                                          Copyright 2026, AlgoGen |
//|                                           https://www.algogen.io |
//+------------------------------------------------------------------+
#property copyright "Copyright 2026, AlgoGen"
#property link      "https://www.algogen.io"
#property version   "1.00"
#property indicator_chart_window

input int InpLookback = 90;   // bars to search for the swing

int OnInit() { return(INIT_SUCCEEDED); }

int OnCalculate(const int rates_total, const int prev_calculated,
                const datetime &time[], const double &open[],
                const double &high[],   const double &low[],
                const double &close[],  const long &tick_volume[],
                const long &volume[],   const int &spread[])
  {
   if(rates_total < InpLookback) return(rates_total);

   // Find the highest high and lowest low over the lookback window.
   int hiShift = iHighest(_Symbol, _Period, MODE_HIGH, InpLookback, 0);
   int loShift = iLowest(_Symbol, _Period, MODE_LOW, InpLookback, 0);

   string name = "AlgoGen_Fibo";
   ObjectDelete(0, name);
   ObjectCreate(0, name, OBJ_FIBO, 0,
                time[rates_total - 1 - hiShift], high[rates_total - 1 - hiShift],
                time[rates_total - 1 - loShift], low[rates_total - 1 - loShift]);

   // Standard retracement levels.
   double levels[] = {0.0, 0.236, 0.382, 0.5, 0.618, 0.786, 1.0};
   ObjectSetInteger(0, name, OBJPROP_LEVELS, ArraySize(levels));
   for(int i = 0; i < ArraySize(levels); i++)
     {
      ObjectSetDouble(0, name, OBJPROP_LEVELVALUE, i, levels[i]);
      ObjectSetString(0, name, OBJPROP_LEVELTEXT, i,
                      DoubleToString(levels[i] * 100.0, 1) + "%");
     }
   return(rates_total);
  }
//+------------------------------------------------------------------+
Install & compile
- Drop it in
MQL5/Indicators/, press F7. - Apply to a chart — it auto-draws a Fibonacci object on the highest high and
lowest low of the last
InpLookbackbars, matching the levels in the output chart.
Gotchas
OBJ_FIBOdoes the level math. You give it the two price/time anchors and the retracement fractions; MT5 renders the horizontal levels.iHighest/iLowestpick the swing by rule.- Redraw, don’t duplicate.
ObjectDeletebeforeObjectCreateeach pass avoids stacking objects on every tick. - Plain lines alternative. If you’d rather compute the prices yourself, each
level is
low + fraction × (high − low)— draw them asOBJ_HLINEobjects. - Extensions. Add fractions above 1.0 (e.g. 1.272, 1.618) to the
levelsarray to project extension targets beyond the swing —OBJ_FIBOwill render those too. - Direction. For retracing an up-move, anchor the object from the low to the high instead; the level percentages then read from the top down.
Same indicator elsewhere: Python, Pine Script, EasyLanguage, NinjaScript. Then test whether the levels hold in AlgoGen.
This post is educational, not financial advice. Indicators describe the past; they don’t predict the future. Backtest anything before you risk real money on it.
Sources and further reading
- Technical indicator functions (MetaQuotes)