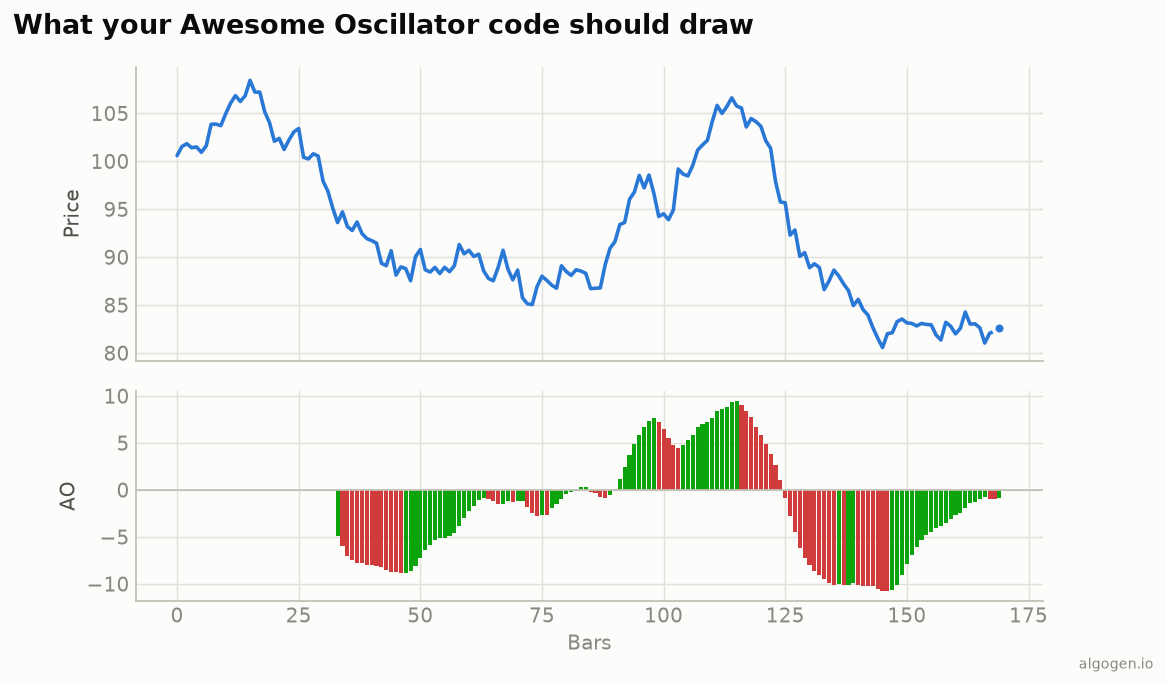
The Awesome Oscillator is a short, satisfying EasyLanguage study — two Average
calls on the median price and a colour rule. See
the explainer for the concept.
What you’ll need
- TradeStation or MultiCharts
- The EasyLanguage / PowerLanguage Editor, new Indicator
The source
{ AlgoGen Awesome Oscillator — TradeStation / MultiCharts }
inputs:
    FastLen( 5 ),
    SlowLen( 34 );

variables:
    Median( 0 ),
    AO( 0 );

Median = ( High + Low ) / 2;
AO = Average( Median, FastLen ) - Average( Median, SlowLen );

Plot1( AO, "AO" );
Plot2( 0, "Zero" );

{ Momentum colouring: green if AO rose vs the prior bar, else red }
if AO >= AO[1] then
    SetPlotColor( 1, Green )
else
    SetPlotColor( 1, Red );
Median = (High + Low) / 2 is the midpoint; Average(Median, 5) - Average(Median, 34) is the AO. Setting the histogram plot to green/red by comparing AO to AO[1]
reproduces the momentum colouring from the output chart. (Set Plot1’s style to
Histogram in the study properties.)
Signals
{ Zero-line cross entries }
if AO crosses over 0 then Buy next bar at market;
if AO crosses under 0 then SellShort next bar at market;
Run the Strategy Performance Report (in a Strategy version) to judge whether AO zero-crosses add anything, ideally with a trend filter.
Bonus: the Accelerator Oscillator
Williams’ companion AC is the AO minus a 5-bar average of itself:
variables: AC( 0 );
AC = AO - Average( AO, 5 );
Plot3( AC, "AC" );
if AC >= AC[1] then SetPlotColor( 3, Green ) else SetPlotColor( 3, Red );
Add it to the study to see momentum acceleration — Williams’ earliest signal. Set Plot3’s style to Histogram in the study properties.
Gotchas
- Median price.
(High + Low) / 2, not close — that’s the defining AO choice. Average, notXAverage. The AO uses simple moving averages; the exponentialXAveragewould change the line.- Colour by momentum. Compare
AOtoAO[1]for the bar colour, not to zero.
Same indicator elsewhere: Python, MQL5, Pine Script, NinjaScript. Then backtest it in AlgoGen.
This post is educational, not financial advice. Indicators describe the past; they don’t predict the future. Backtest anything before you risk real money on it.
Sources and further reading
- What is EasyLanguage? (TradeStation)