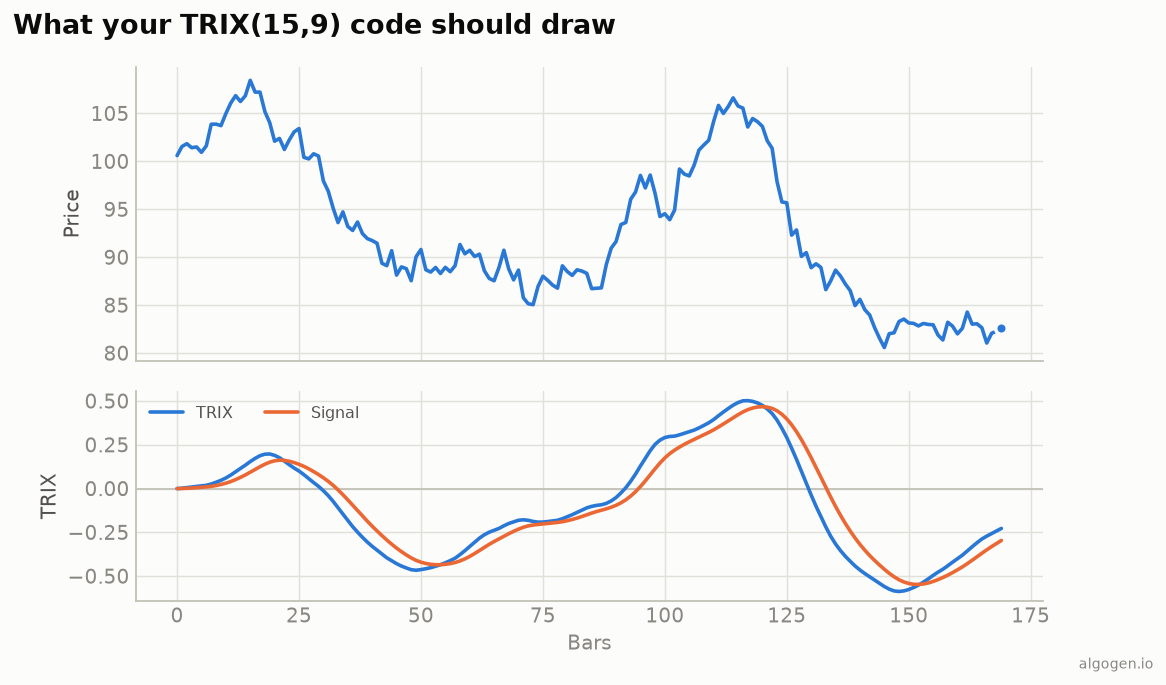
TRIX in EasyLanguage is three chained XAverage calls plus a rate of change. See
the explainer for the concept.
What you’ll need
- TradeStation or MultiCharts
- The EasyLanguage / PowerLanguage Editor, new Indicator
The source
{ AlgoGen TRIX — TradeStation / MultiCharts }
inputs:
    Length( 15 ),
    SignalLen( 9 );

variables:
    E1( 0 ), E2( 0 ), E3( 0 ), TrixVal( 0 ), SignalVal( 0 );

E1 = XAverage( Close, Length );
E2 = XAverage( E1, Length );
E3 = XAverage( E2, Length );      { triple exponential }

if E3[1] <> 0 then
    TrixVal = 100 * ( E3 - E3[1] ) / E3[1]
else
    TrixVal = 0;

SignalVal = XAverage( TrixVal, SignalLen );

Plot1( TrixVal, "TRIX" );
Plot2( SignalVal, "Signal" );
Plot3( 0, "Zero" );
XAverage is EasyLanguage’s EMA; chaining it three times gives the triple
smoothing, and 100 * (E3 - E3[1]) / E3[1] is the one-bar rate of change — the two
lines from the output chart.
Signals
if TrixVal crosses over SignalVal then Alert( "TRIX bullish cross" );
if TrixVal crosses over 0 then Alert( "TRIX crossed above zero" );
Wrap it in a Strategy to backtest the crosses:
{ AlgoGen TRIX Cross — Strategy }
inputs: Length( 15 ), SignalLen( 9 );
variables: E1( 0 ), E2( 0 ), E3( 0 ), TrixVal( 0 ), SignalVal( 0 );
E1 = XAverage( Close, Length ); E2 = XAverage( E1, Length ); E3 = XAverage( E2, Length );
if E3[1] <> 0 then TrixVal = 100 * ( E3 - E3[1] ) / E3[1];
SignalVal = XAverage( TrixVal, SignalLen );

if TrixVal crosses over SignalVal then Buy next bar at market;
if TrixVal crosses under SignalVal then Sell next bar at market;
Because TRIX is heavily smoothed, expect fewer trades than a fast oscillator — the Strategy Performance Report will confirm the trade-off between lag and cleanliness.
Gotchas
- Chain the averages.
E2 = XAverage( E1, Length ), notXAverage( Close, ...)again — each smoothing feeds the next. XAverage, notAverage. TRIX is triple exponential; the simpleAveragewould give a different indicator.- ROC last. Take the rate of change of the third average, after all three smoothings.
Same indicator elsewhere: Python, MQL5, Pine Script, NinjaScript. Then backtest it in AlgoGen.
This post is educational, not financial advice. Indicators describe the past; they don’t predict the future. Backtest anything before you risk real money on it.
Sources and further reading
- What is EasyLanguage? (TradeStation)