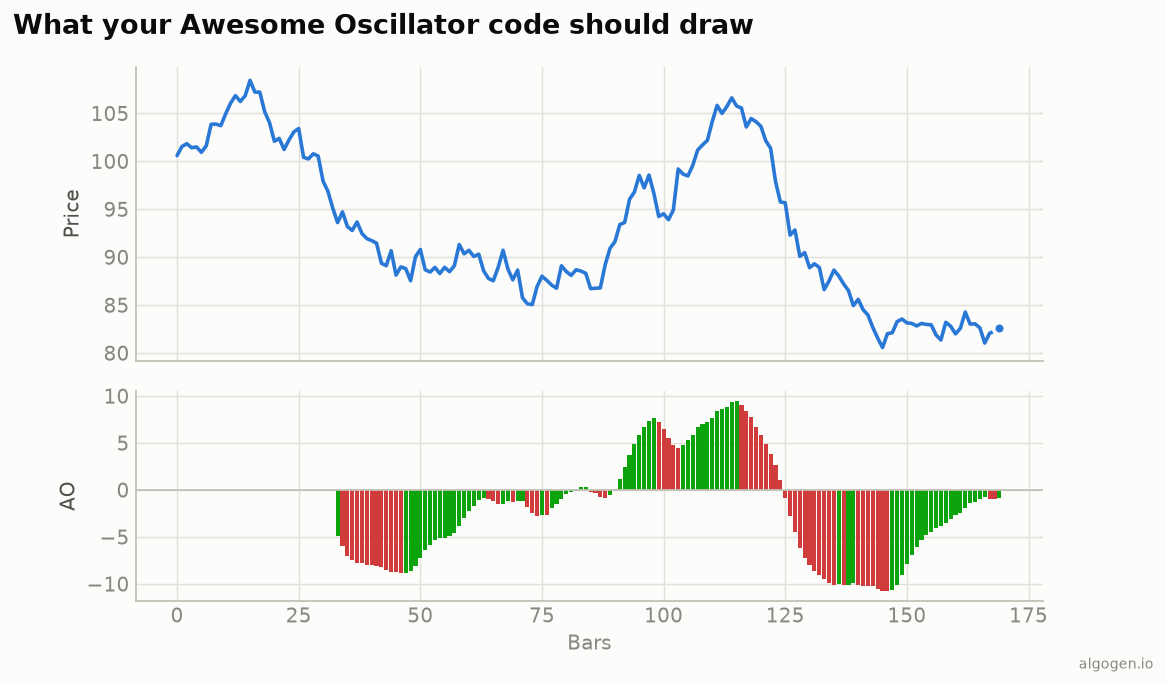
MetaTrader has an Awesome Oscillator, but building your own is a clean lesson in MT5’s two-colour histogram buffers. See the explainer for the concept.
What you’ll need
- MetaTrader 5 with MetaEditor
- Save as
AlgoGen.AO.mq5underMQL5/Indicators/
The source
//+------------------------------------------------------------------+
//|                                                   AlgoGen.AO.mq5 |
//|                                          Copyright 2026, AlgoGen |
//|                                           https://www.algogen.io |
//+------------------------------------------------------------------+
#property copyright "Copyright 2026, AlgoGen"
#property link      "https://www.algogen.io"
#property version   "1.00"
#property indicator_separate_window
#property indicator_buffers 3
#property indicator_plots   1

#property indicator_label1  "AO"
#property indicator_type1   DRAW_COLOR_HISTOGRAM
#property indicator_color1  clrMediumSeaGreen, clrIndianRed
#property indicator_width1  3

input int InpFast = 5;
input int InpSlow = 34;

double AOBuffer[], ColorBuffer[], MedBuffer[];

int OnInit()
  {
   SetIndexBuffer(0, AOBuffer,    INDICATOR_DATA);
   SetIndexBuffer(1, ColorBuffer, INDICATOR_COLOR_INDEX);
   SetIndexBuffer(2, MedBuffer,   INDICATOR_CALCULATIONS);
   IndicatorSetString(INDICATOR_SHORTNAME, "AlgoGen AO");
   return(INIT_SUCCEEDED);
  }

double SmaOf(const double &buf[], int i, int period)
  {
   double s = 0.0;
   for(int j = 0; j < period; j++) s += buf[i - j];
   return s / period;
  }

int OnCalculate(const int rates_total, const int prev_calculated,
                const datetime &time[], const double &open[],
                const double &high[],   const double &low[],
                const double &close[],  const long &tick_volume[],
                const long &volume[],   const int &spread[])
  {
   if(rates_total < InpSlow) return(0);

   int tpStart = (prev_calculated > 1) ? prev_calculated - 1 : 0;
   for(int i = tpStart; i < rates_total; i++)
      MedBuffer[i] = (high[i] + low[i]) / 2.0;

   int start = (prev_calculated > InpSlow) ? prev_calculated - 1 : InpSlow - 1;
   for(int i = start; i < rates_total; i++)
     {
      AOBuffer[i] = SmaOf(MedBuffer, i, InpFast) - SmaOf(MedBuffer, i, InpSlow);
      // Colour: 0 = green (rose vs prior), 1 = red (fell).
      ColorBuffer[i] = (i > 0 && AOBuffer[i] < AOBuffer[i - 1]) ? 1 : 0;
     }
   return(rates_total);
  }
//+------------------------------------------------------------------+
Install & compile
- Drop it in
MQL5/Indicators/, press F7. - Drag onto a chart — a separate window shows the green/red AO histogram, matching the output chart.
Gotchas
DRAW_COLOR_HISTOGRAM. This is what lets a single plot switch colours per bar; theINDICATOR_COLOR_INDEXbuffer holds 0/1 to pick green or red.- Colour by momentum, not sign. The bar is green when AO rose from the prior bar and red when it fell — not by whether AO is positive or negative.
- Median price.
(high + low) / 2, computed into its own calculations buffer. - MQL4. Same math; MQL4’s older histogram styling uses two buffers for the up/down colours instead of a color-index buffer.
Same indicator elsewhere: Python, Pine Script, EasyLanguage, NinjaScript. Then test an AO rule in AlgoGen.
This post is educational, not financial advice. Indicators describe the past; they don’t predict the future. Backtest anything before you risk real money on it.
Sources and further reading
- Technical indicator functions (MetaQuotes)