Yes, it’s genuinely called the “Awesome Oscillator.” The name is pure Bill Williams showmanship, but the tool underneath is sober and simple: it’s the difference between two moving averages of the bar’s midpoint. If you know the MACD, you already know 90% of this — it’s a close cousin with a few deliberate tweaks. Let’s do the math.
The one-sentence job
The Awesome Oscillator measures momentum as the gap between a fast (5-period) and slow (34-period) simple moving average of the median price. When short-term momentum outruns the longer term, the histogram rises; when it fades, it falls.
The formula
Median Price = (High + Low) / 2
AO = SMA(Median Price, 5) − SMA(Median Price, 34)
Three deliberate choices distinguish it from the MACD:
- Median price, not close. Williams uses
(H+L)/2— the bar’s midpoint — rather than the closing price, on the theory that the midpoint better reflects the bar’s whole activity, not just where it happened to settle. - Simple moving averages, not exponential. The MACD uses EMAs; the AO uses plain SMAs.
- No signal line. The AO is just the one histogram (with no EMA-of-itself trigger line), read via its bars and the zero line.
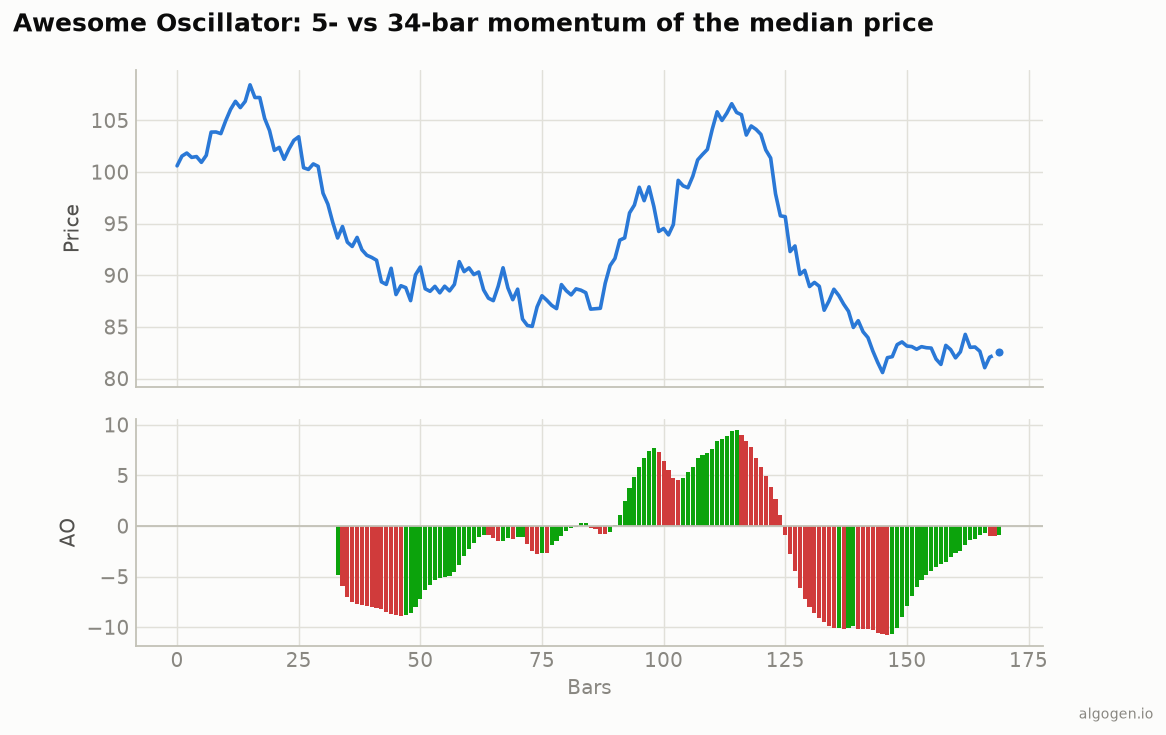
The result is plotted as a histogram, and — this is the Bill Williams part — each bar is coloured by momentum direction: green if the current AO is higher than the previous bar, red if lower. On the chart above, a run of green bars is building momentum, red is fading.
How to read it
Zero-line cross. AO crossing above zero means the fast midpoint average has overtaken the slow one — momentum turning up (and vice versa). The simplest read.
The saucer. Williams’ signature signal. In a bull saucer, AO is above zero, you see two consecutive red (falling) bars followed by a green (rising) bar — a brief dip in momentum that reasserts. It’s a pullback-entry pattern.
Twin peaks. A divergence-style signal: two peaks on the same side of zero where the second is lower (bearish twin peaks above zero) or higher (bullish below zero), hinting momentum is shifting.
Bar colour. Green = momentum increasing this bar, red = decreasing — regardless of whether AO is positive or negative.
Where it fits
The AO wasn’t meant to stand alone. It’s one instrument in Bill Williams’ broader trading system (alongside his “Alligator” moving averages, Fractals, and the Accelerator Oscillator). Read in isolation it’s a decent momentum histogram; read as part of his method it’s a confirming gear. Either way, treat it as momentum context, not a standalone oracle.
The settings
5 and 34 are the fixed defaults and rarely changed — they’re part of the indicator’s identity. (34 and 5 are Fibonacci numbers, which fits Williams’ leanings, though the practical effect is simply a fast-vs-slow momentum spread.)
Its sibling, the Accelerator Oscillator
Bill Williams paired the AO with the Accelerator Oscillator (AC), defined as
AC = AO − SMA(AO, 5). Where the AO gauges momentum, the AC gauges the change in
momentum — the reasoning being that acceleration turns before momentum, which turns
before price. It’s the same green/red bar treatment applied one derivative up. If
you find the AO useful, the AC is a natural companion, and it’s a two-line addition
(see the code posts).
Where it lies to you
- It lags. The 34-period slow average makes the AO slow to turn — it confirms momentum shifts rather than predicting them.
- Unbounded and instrument-dependent. Like the MACD, AO values depend on the price and volatility of the instrument; you can’t compare AO readings across different assets.
- Signals need context. Saucers and twin peaks generate a lot of candidates; without a trend or higher-timeframe filter they whipsaw.
The Awesome Oscillator is a tidy momentum histogram with a memorable name and a couple of distinctive tweaks. Strip away the branding and it’s two midpoint averages subtracted — useful, honest, and, like everything here, free to build.
Now go test it, don’t trust it
Do AO zero-crosses or saucers actually add an edge on your market? That’s a backtest. Build it in AlgoGen and see. Then build the AO yourself in Python, MQL5, Pine Script, EasyLanguage, or NinjaScript.
This post is educational, not financial advice. Indicators describe the past; they don’t predict the future. Backtest anything before you risk real money on it.