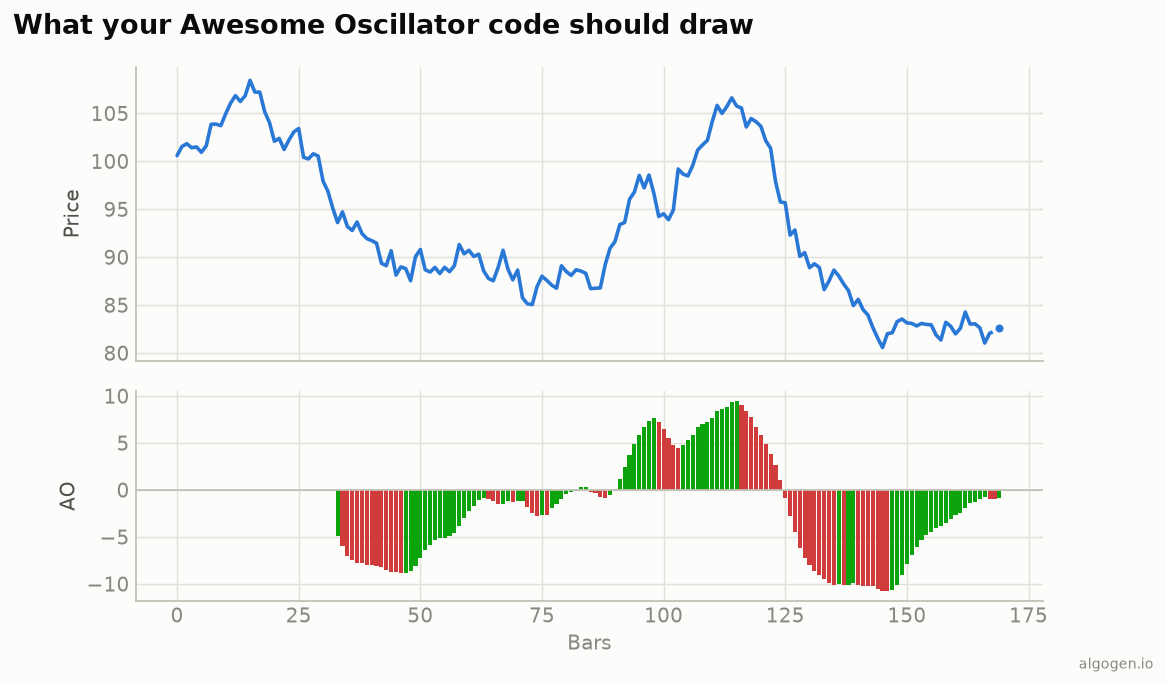
The Awesome Oscillator is a few lines in Pine — median price, two SMAs, a difference, and the signature colour-by-momentum bars. See the explainer for the concept.
What you’ll need
- A TradingView account (free tier is fine)
- The Pine Editor
The source
//@version=5
indicator("AlgoGen Awesome Oscillator", shorttitle="AG AO", overlay=false)

fast = input.int(5,  "Fast")
slow = input.int(34, "Slow")

ao = ta.sma(hl2, fast) - ta.sma(hl2, slow)   // hl2 = (high + low) / 2

aoColor = ao >= ao[1] ? #0ca30c : #d03b3b    // green if rising, red if falling
plot(ao, "AO", style=plot.style_columns, color=aoColor)
hline(0, "Zero", color=color.gray)
hl2 is TradingView’s built-in median price (high+low)/2, so the AO is just
ta.sma(hl2, 5) - ta.sma(hl2, 34). The aoColor line applies Bill Williams’
momentum colouring — green when the bar is higher than the last, red when lower —
matching the output chart.
Saucer and zero-cross signals
zeroBull = ta.crossover(ao, 0)
// Bull saucer: AO above zero, two down bars, then an up bar.
saucer = ao > 0 and ao[2] > ao[3] ? false : (ao > 0 and ao[1] < ao[2] and ao[2] < ao[3] and ao > ao[1])
plotshape(zeroBull, "Zero cross up", shape.triangleup, location.bottom, color=#0ca30c, size=size.tiny)
alertcondition(zeroBull, "AO zero cross up", "AO crossed above zero")
Bonus: the Accelerator Oscillator
Williams’ companion, the AC, is the AO minus a 5-SMA of itself — two more lines:
ac = ao - ta.sma(ao, 5)
acColor = ac >= ac[1] ? #0ca30c : #d03b3b
plot(ac, "AC", style=plot.style_columns, color=acColor)
Put it in a second pane or overlay it; rising AC bars flag momentum that is accelerating, which Williams treated as the earliest of his “go” signals.
Gotchas
hl2, notclose. The AO uses the median price;closewould give a different oscillator.ta.sma, notta.ema. Simple moving averages define the AO; EMAs make it a MACD-like variant.- Colour by momentum. Compare
aotoao[1]for the bar colour — not to zero. A green bar can be below zero (momentum improving within a downtrend).
Same indicator elsewhere: Python, MQL5, EasyLanguage, NinjaScript. Then test an AO rule in AlgoGen.
This post is educational, not financial advice. Indicators describe the past; they don’t predict the future. Backtest anything before you risk real money on it.
Sources and further reading
- Pine Script built-ins (TradingView)