Most indicators are named after their inventor by other people, decades later, as a kind of informal honor. Bollinger Bands are unusual: the man who made them not only got his name attached while he was very much alive and on television, he eventually registered that name as a trademark. It’s one of the few indicators with actual intellectual-property paperwork — which makes the fact that you can still build them yourself for free all the more satisfying.
A market analyst on live TV
John Bollinger developed his bands in the early 1980s while working as the chief market analyst for the Financial News Network (FNN), the cable predecessor to the financial-TV channels we know today. Picture the job: you’re on air, live, expected to say something intelligent about where prices are relative to “normal.” He needed a tool that could answer, at a glance, is this price high or low, given how volatile things have been lately?
He reportedly introduced the bands on an FNN broadcast around 1983, and — the charming part — they didn’t have a name yet. As the story goes, he was put on the spot on air to call them something, and “Bollinger Bands” is what came out. The name stuck, which is more than can be said for most things said live on cable television.
The problem he was solving
The idea of drawing bands around a moving average wasn’t new. Traders already used percentage envelopes — lines drawn a fixed percentage above and below a moving average (say ±3%). The trouble is that a fixed percentage is dumb about volatility. In a sleepy market, ±3% bands are miles too wide to be useful; in a panic, they’re far too narrow and price blows straight through them. The envelope never adapts.
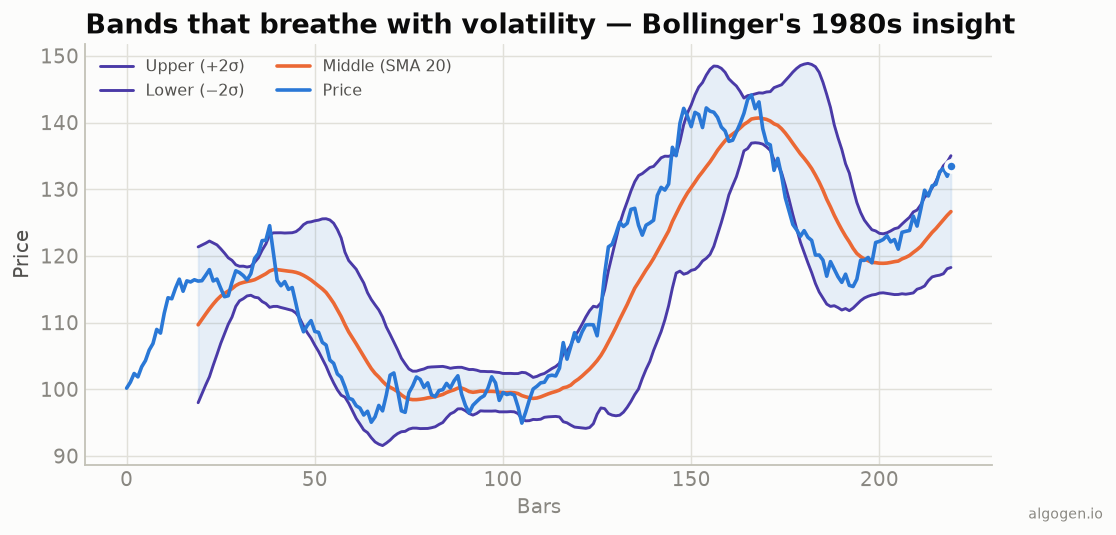
Bollinger’s insight was to make the band width driven by volatility itself by using the standard deviation of recent prices. When the market is calm, standard deviation is small and the bands automatically tighten; when it’s wild, they widen to match. The bands breathe. That single substitution — swap a fixed percentage for a statistical measure of dispersion — turned a crude envelope into one of the most enduring tools in technical analysis. You can watch the bands breathe in the chart above: wide through the volatile swings, pinched through the quiet stretches.
Standardizing the language
Bollinger did something else valuable: he defined companion measures so the bands could be discussed precisely rather than by vibes. %b quantifies where price sits within the bands, and bandwidth quantifies how wide they are — the metric that turned “the bands look tight” into a number you can screen and backtest. He also catalogued patterns like M-tops and W-bottoms. Much of this he collected in his 2001 book Bollinger on Bollinger Bands, which remains the canonical reference straight from the source.
The trademark
In 2011, Bollinger registered “Bollinger Bands” as a U.S. trademark. It’s a quirky footnote — an indicator formula can’t really be owned, and the math is freely reproducible (as this whole series demonstrates), but the name is his. It speaks to how thoroughly the tool became identified with one person.
Bollinger never stopped working on the idea, either. He built a career around it — running a market-analysis firm, publishing research, and maintaining a dedicated site (bollingerbands.com) where he documents the “rules” for using the bands correctly. That ongoing stewardship is part of why the bands avoided the fate of many indicators that get mangled by half-remembered folklore: the author kept publicly correcting the record, especially the myth that a band touch is an automatic buy or sell.
Why it endured
Bollinger Bands hit the same sweet spot as the other classics: a clean formula a computer loves, a genuinely useful idea (adaptive volatility), and a memorable name attached to a credible, visible author. When charting software spread, the bands were trivial to include and instantly recognizable. Today they’re a default overlay on essentially every platform.
And here’s the Mustachian punchline: the tool a TV analyst trademarked, the one that gets treated as arcane, is nothing more than an average plus a standard deviation. You can build the exact thing in an afternoon — which is precisely what we do in the implementation posts.
This post is educational, not financial advice. Indicators describe the past; they don’t predict the future. Backtest anything before you risk real money on it.
Sources and further reading
- John Bollinger's official Bollinger Bands reference (Bollinger Capital Management)