The Accumulation/Distribution Line sits at the root of a whole family tree of volume indicators — the one that later branched into Chaikin Money Flow and the Chaikin Oscillator. To understand it is to understand Marc Chaikin’s entire approach to reading volume, and to untangle a genuinely confusing bit of naming history.
Chaikin’s founding idea
As covered in the CMF history, Marc Chaikin spent his career
(beginning on Wall Street in the 1960s) convinced that volume, read correctly, reveals
what large players are doing. His foundational move was the close-location value —
the money flow multiplier ((Close − Low) − (High − Close)) / (High − Low). Its logic:
a close near the high means buyers dominated the bar (accumulation); near the low means
sellers dominated (distribution). Multiply that by the bar’s volume and you have a
signed measure of the session’s net pressure.
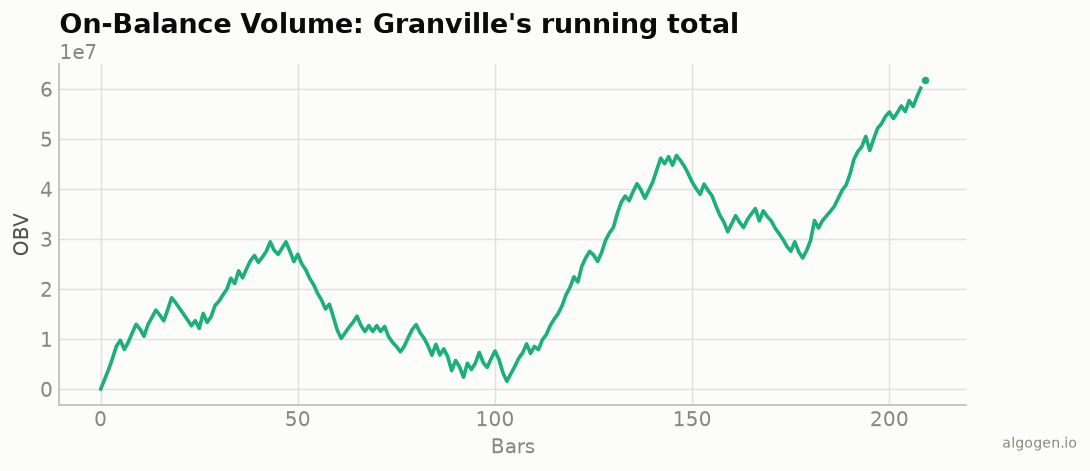
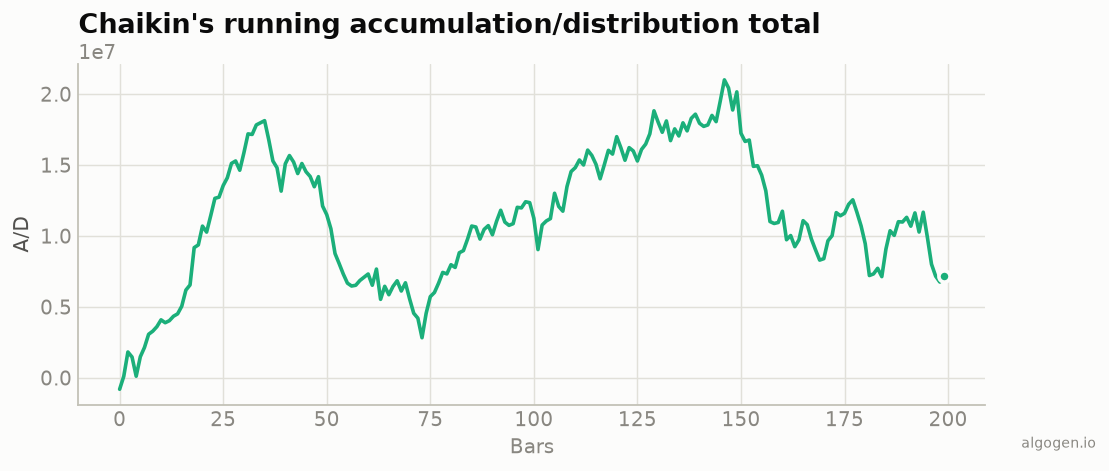
The A/D Line is the most direct expression of that idea: just keep a running, cumulative sum of money flow volume. When accumulation dominates over time, the line climbs; when distribution dominates, it falls. It was Chaikin’s improvement on the cruder cumulative-volume approach of OBV, which threw away the information about where in its range a bar closed.
The family it spawned
The A/D Line proved to be a base layer that Chaikin and others built on:
- The Chaikin Oscillator applies a MACD-style difference of two EMAs to the A/D Line, turning the cumulative total into a zero-centered momentum reading of money flow.
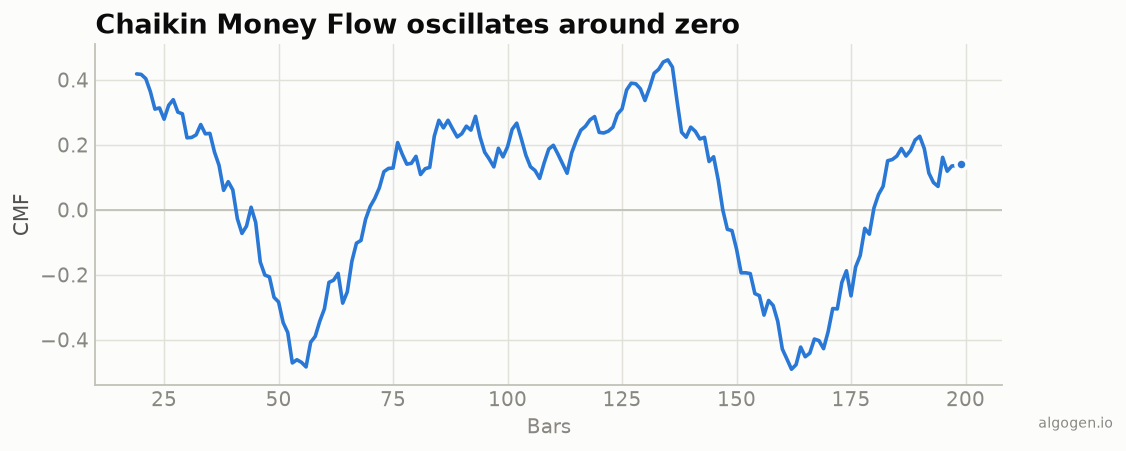
- Chaikin Money Flow takes the same money flow volume but sums it over a fixed window and normalizes by volume, producing a bounded oscillator instead of a running total.
So three well-known indicators — the A/D Line, the Chaikin Oscillator, and CMF — all descend from that one close-location-value idea. It’s a tidy example of how a single good primitive gets recombined into a whole toolkit.
The naming tangle worth untangling
Here’s the confusing part. There are two different “Accumulation/Distribution” concepts in common use, and people mix them up constantly:
- Chaikin’s A/D Line — the close-location version described here (where the close sits within the high-low range). This is the one on most platforms labeled simply “Accumulation/Distribution.”
- Williams’ Accumulation/Distribution — a separate indicator devised by Larry Williams, based on the close relative to the open (and the prior close), not the high-low range.
They share a name and a goal but use different arithmetic. If two sources describe “the A/D indicator” differently, this is almost always why. In this cluster — and on most modern charting software — “A/D Line” means Chaikin’s close-location version.
Why it endured
The A/D Line endured because it does OBV’s job better, and because it anchors a whole family of respected volume tools. It’s cheap to compute, it plots cleanly, and its divergences against price are a classic, time-tested tell. And, as always in this series, there’s nothing to buy: a close-location multiplier, a volume weight, and a cumulative sum. You can build Chaikin’s exact line in a couple of lines, which is what we do in the implementation posts.
This post is educational, not financial advice. Indicators describe the past; they don’t predict the future. Backtest anything before you risk real money on it.