Some analysts spend a career refining a single idea. Marc Chaikin spent his obsessing over one question: what is volume really telling us? Out of that obsession came a whole family of related indicators — the Accumulation/Distribution line, the Chaikin Oscillator, and Chaikin Money Flow — each a different lens on the same underlying insight. CMF is arguably the most readable of the bunch.
A volume man from the 1960s
Chaikin began his Wall Street career in the 1960s, and from early on he was fixated on volume as the key to understanding price. That’s a meaningful stance: plenty of analysts treat volume as an afterthought, but Chaikin built his life’s work on the premise that how much trades — and where in a bar it trades — reveals the footprints of large, informed players. He wanted to see the “smart money” accumulating or distributing before it fully showed up in price.
The key insight: where the close lands
Chaikin’s foundational idea was the close location value — the money flow
multiplier at the heart of both CMF and the A/D line: ((Close − Low) − (High − Close)) / (High − Low). The reasoning is intuitive. If a bar closes near its
high, buyers won the session and that bar’s volume represents accumulation; if it
closes near its low, sellers won and it’s distribution. Multiply that location
value by the bar’s volume and you get a signed measure of how much accumulation or
distribution actually happened.
That single idea powers his whole toolkit:
- The Accumulation/Distribution line (which we cover in its own cluster) is the running cumulative total of money flow volume — unbounded, like a smarter OBV.
- The Chaikin Oscillator is the MACD of that A/D line.
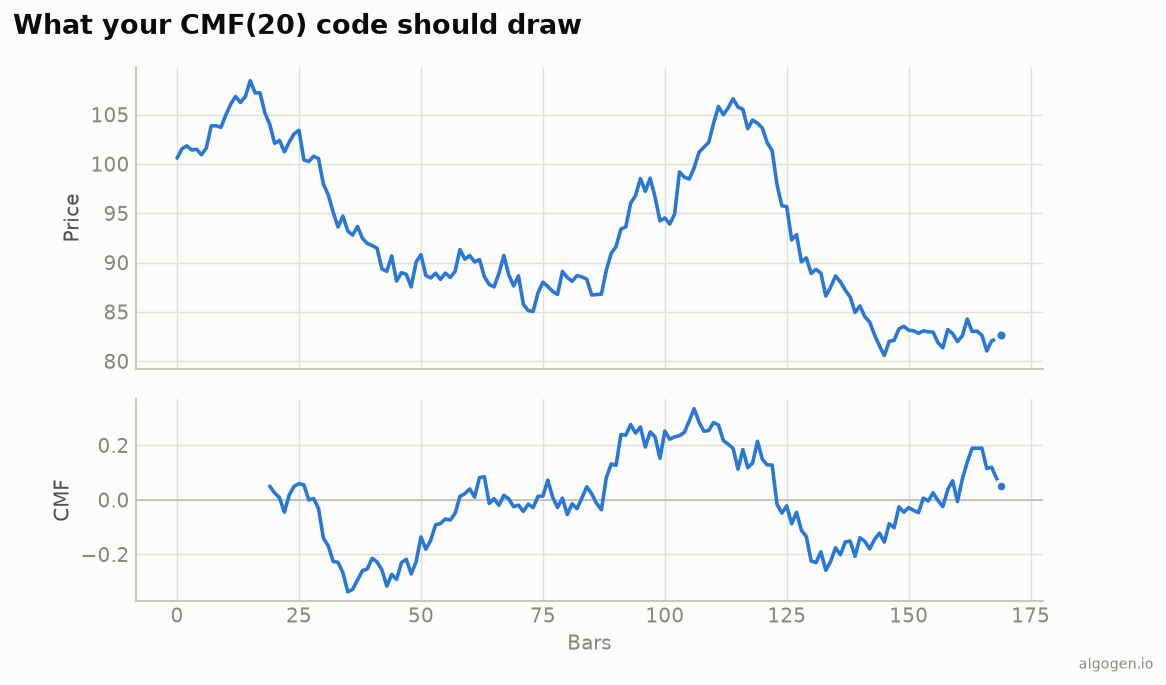
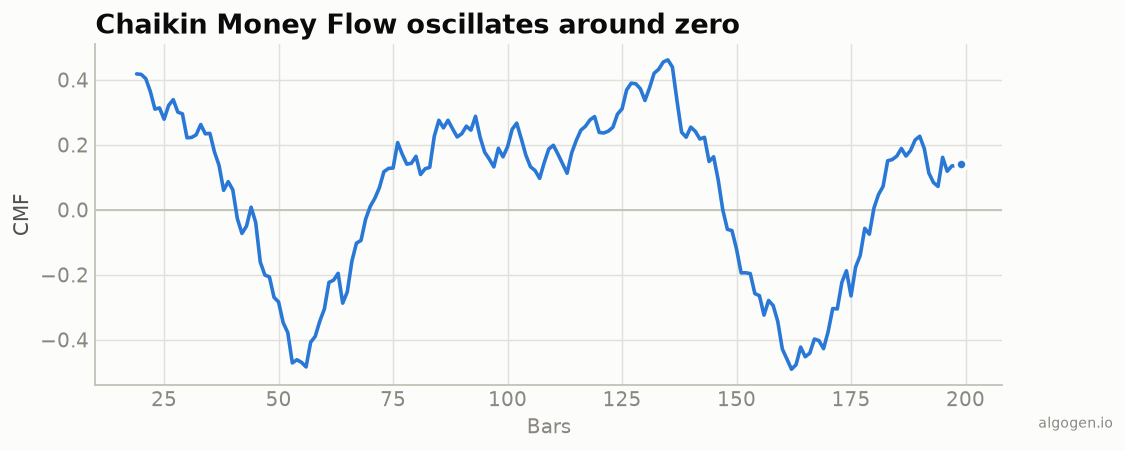
- Chaikin Money Flow, developed in the early 1980s, takes the same money flow volume but sums it over a fixed window and normalizes by total volume, producing a bounded oscillator around zero.
Why CMF, when the A/D line already existed?
The A/D line is powerful but has the same readability problem as OBV: it’s a cumulative running total with no natural scale, so you can only read its shape and divergences, never its level. CMF solved that. By windowing and normalizing, Chaikin turned the same information into a bounded oscillator you can actually threshold — “is CMF above or below zero, and by how much?” That made money-flow analysis far more accessible to ordinary traders, which is a big reason CMF spread so widely.
Chaikin’s volume work proved durable enough that he built a modern analytics business around these ideas decades later — a rare case of an indicator author turning a lifelong thesis into a company.
A note on attribution
Volume-based accumulation/distribution has a slightly tangled history: Larry Williams also devised an accumulation/distribution concept (based on close-versus-open), and the two are sometimes confused. The tools in this cluster — the money-flow-multiplier A/D line and CMF — are Chaikin’s. It’s a good reminder that several sharp minds circled volume analysis in the same era, arriving at related but distinct formulas.
Why it endured
CMF endured because it made a genuinely useful idea readable: buying vs selling pressure, bounded and zero-centered, in one line. It’s cheap to compute, it plots cleanly, and it gives a clear thresholdable signal. And, as always in this series, there’s nothing to buy — a money flow multiplier, a couple of rolling sums, and a division. You can build Chaikin’s exact indicator in a few lines, which is what we do in the implementation posts.
This post is educational, not financial advice. Indicators describe the past; they don’t predict the future. Backtest anything before you risk real money on it.