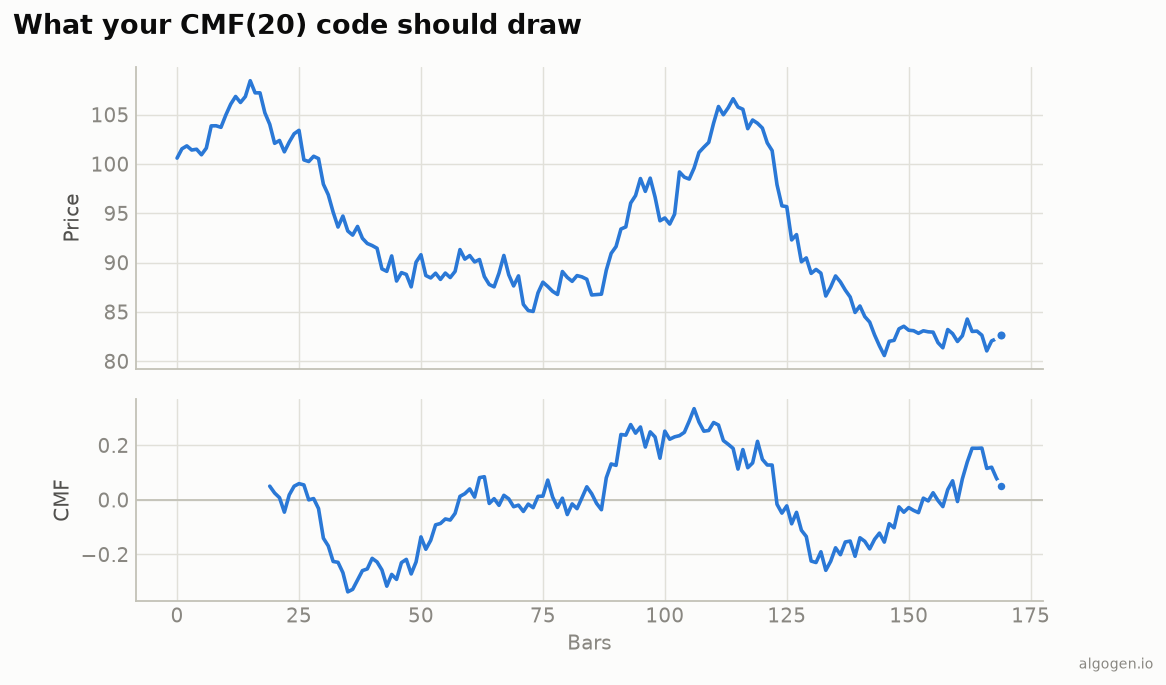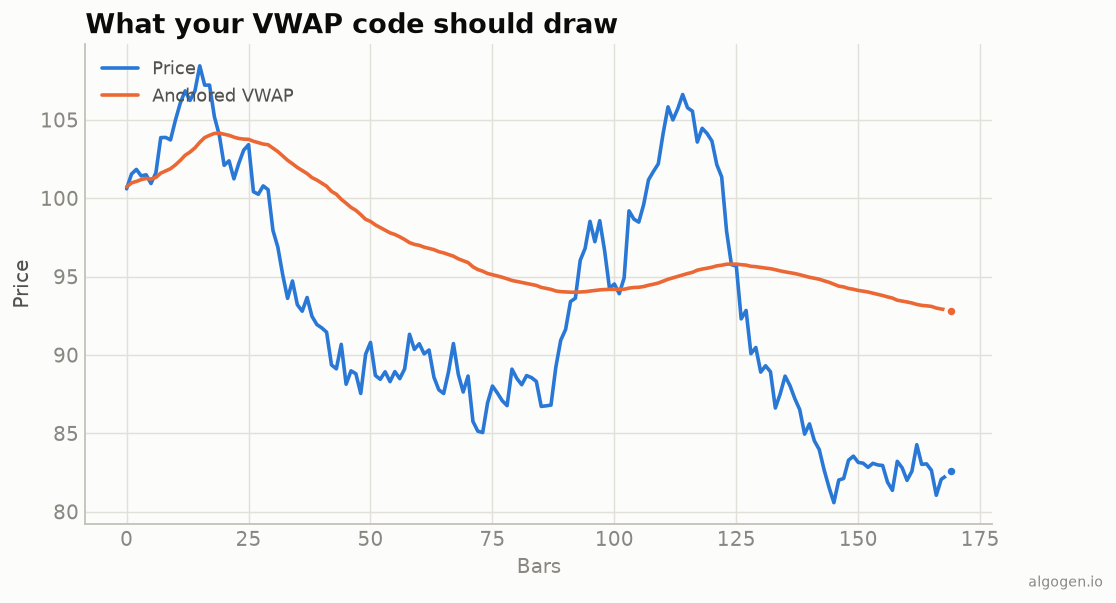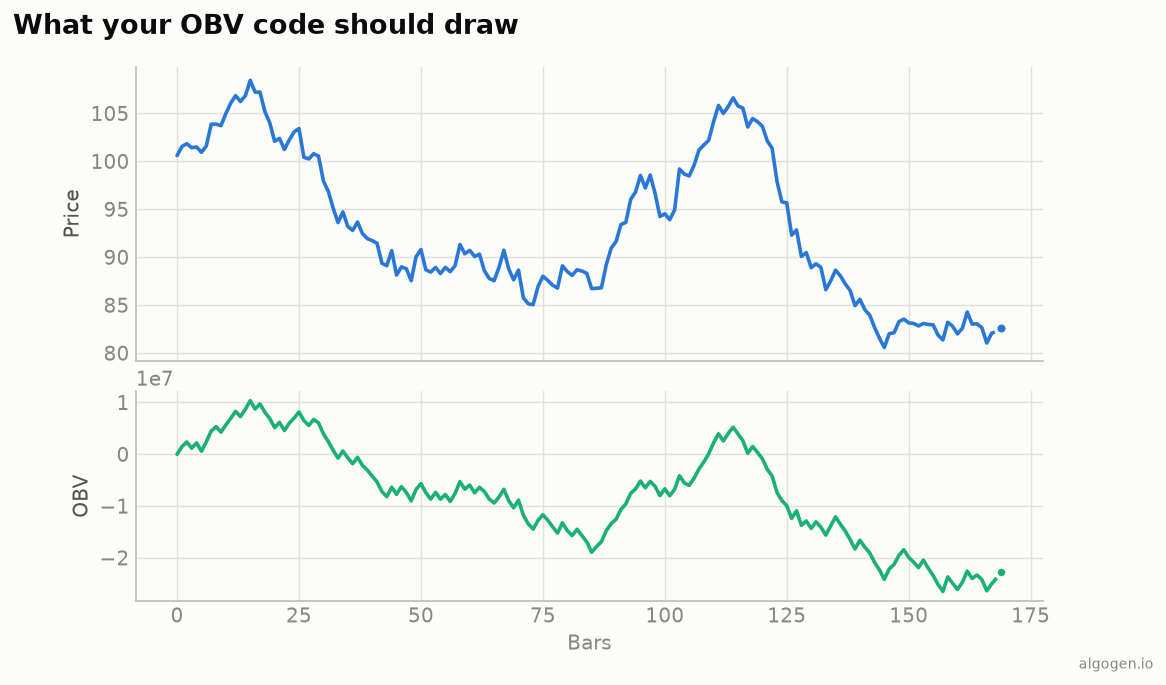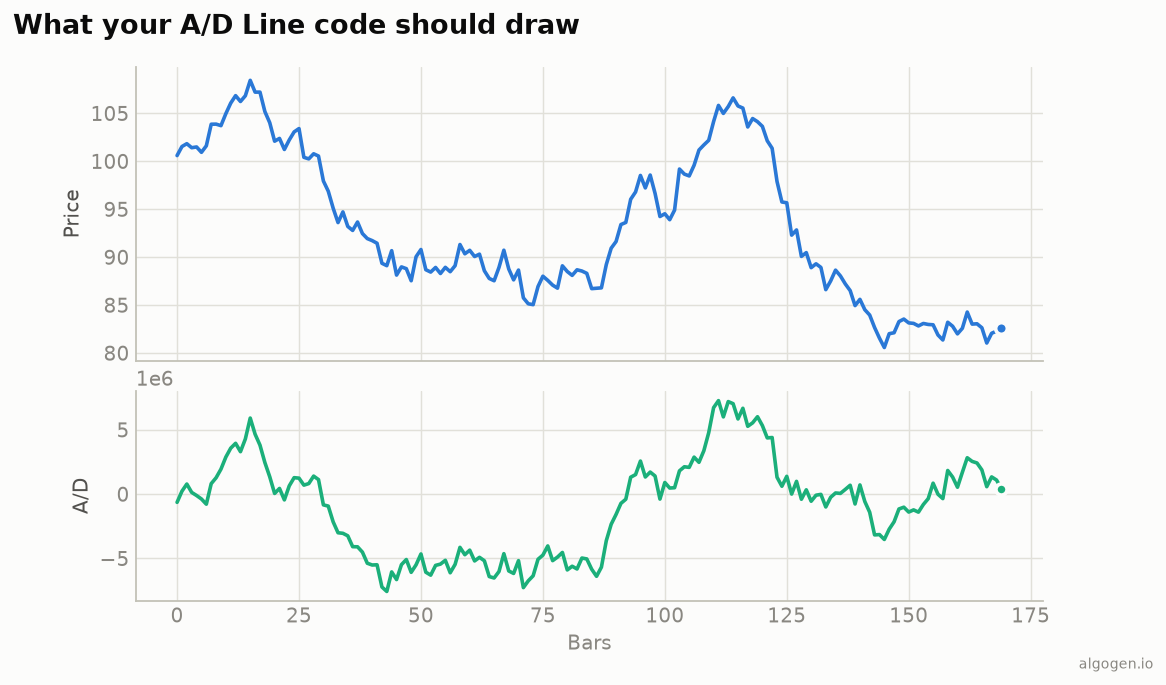
The A/D Line is the CMF money flow volume, accumulated instead of windowed — a two-line indicator in pandas. The explainer covers the concept; here’s the code, plus the Chaikin Oscillator bonus.
What you’ll need
- Python 3.9+,
pandas/numpy high,low,close,volumeseries.
From scratch
import numpy as np
import pandas as pd


def ad_line(high, low, close, volume):
    rng = (high - low).replace(0, np.nan)              # guard flat bars
    mfm = ((close - low) - (high - close)) / rng       # money flow multiplier
    mfm = mfm.fillna(0.0)
    mfv = mfm * volume                                 # money flow volume
    return mfv.cumsum().rename("ad")                   # running total
The multiplier is the close-location value; multiplying by volume signs and scales it;
cumsum() accumulates it into the running A/D Line from the output chart. The only
difference from CMF is cumsum() instead of a windowed, normalized sum.
The Chaikin Oscillator
Chaikin’s companion is a MACD of the A/D Line:
ad = ad_line(df["high"], df["low"], df["close"], df["volume"])
chaikin_osc = (ad.ewm(span=3, adjust=False).mean()
               - ad.ewm(span=10, adjust=False).mean())
That turns the cumulative line into a zero-centered momentum reading of money flow — a handy, boundedish signal derived from the same data.
Divergence, in code
win = 20
price_up = df["close"] > df["close"].shift(win)
ad_down = ad < ad.shift(win)
df["bearish_div"] = price_up & ad_down    # price up, money flow down
bearish_div flags where price rose but the A/D Line fell — the distribution warning
to test in AlgoGen.
Gotchas
- Flat-bar guard.
high == lowdivides by zero in the multiplier;replace/fillnaset those bars neutral. - Cumulative, not windowed.
cumsum()is what makes it the A/D Line; window-and- normalize instead and you’ve built CMF. - Read slope, not level. The absolute value is arbitrary; watch direction and divergence.
The lazy one-liner
import pandas_ta as ta
df["ad"] = ta.ad(df["high"], df["low"], df["close"], df["volume"])
Same indicator elsewhere: MQL5, Pine Script, EasyLanguage, NinjaScript.
This post is educational, not financial advice. Indicators describe the past; they don’t predict the future. Backtest anything before you risk real money on it.
Sources and further reading
- Windowing operations (pandas documentation)