Almost every indicator in this series was born to answer “should I buy or sell?” VWAP was born to answer a completely different question: “did I get ripped off?” It started life on institutional trading desks as a way to grade execution quality, and only decades later did it become the fair-value line plastered across day-trading screens. That unusual heritage is why it behaves so differently from the other tools here.
The problem: moving an elephant
Imagine you run a pension fund and need to buy ten million shares of a stock. You can’t just hit “buy” — an order that size would ram the price up against you. Instead you feed it into the market in pieces over hours or days. Afterward, a crucial question remains: did your traders execute well, or did they get poor prices? You need a fair yardstick — the average price the stock traded at while you were buying, weighted by volume. Beat that average and you did well; lag it and you left money on the table.
That yardstick is VWAP.
1984: the first execution benchmark
The first practical use of VWAP as an execution benchmark is generally attributed to James Elkins, then head trader at the New York agency brokerage Abel Noser, who applied it in 1984 for the Ford Motor Company pension fund. It was, from the very start, a tool for measuring institutional execution — not a chart squiggle for timing entries.
1988: the academic stamp
The idea was formalized in a landmark 1988 paper in the Journal of Finance by Berkowitz, Logue, and Noser, which used VWAP as the benchmark for measuring the total transaction cost of trading on the New York Stock Exchange. That paper cemented VWAP as the standard for evaluating execution quality, and it soon became embedded in how the whole institutional world thinks about trading costs.
Because it was a benchmark, an entire industry grew around hitting it: VWAP execution algorithms that slice a big order into pieces timed to trade in proportion to market volume, so the fund’s realized average price lands as close as possible to the day’s VWAP. If everyone’s goal is to trade at VWAP, VWAP becomes a genuine center of gravity in the market — a rare example of an indicator that influences the very prices it measures.
The retail takeover
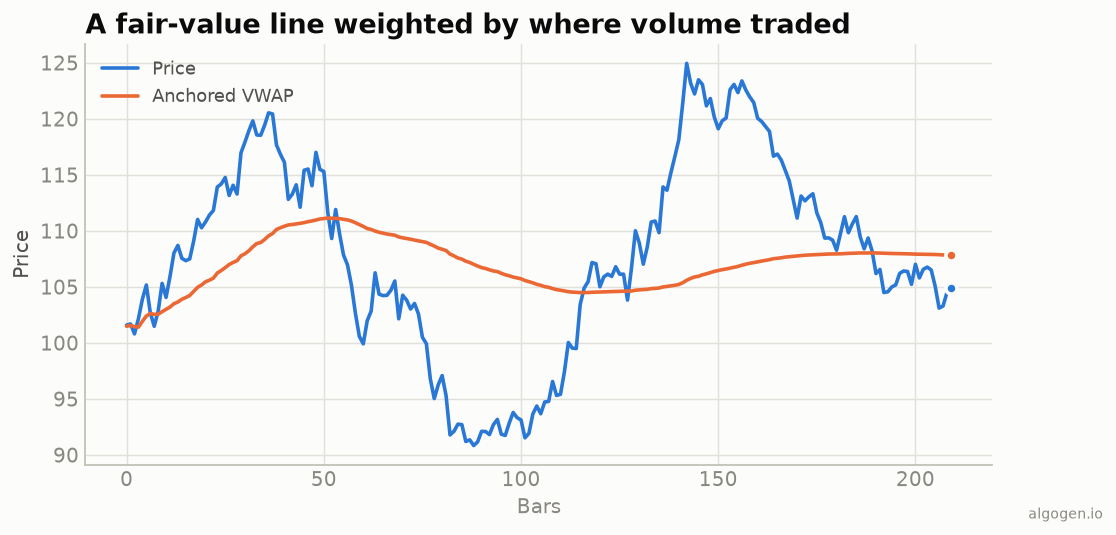
For years VWAP lived almost entirely on institutional desks. Then charting platforms added it, and day traders discovered that the line the big players watched made an excellent intraday reference: above VWAP, buyers had the edge; below it, sellers did. It became one of the most-watched intraday levels in the retail world, especially for momentum and scalping strategies.
More recently, anchored VWAP — starting the VWAP calculation from a significant event like an earnings report, a major high, or a major low rather than the session open — brought VWAP thinking to higher timeframes and swing trading. Popularized by traders such as Brian Shannon, anchored VWAP turned a strictly-intraday benchmark into a flexible tool you can drop from any pivotal moment on the chart.
Why it endured
VWAP survived the jump from execution desk to retail screen because it measures something genuinely real: where value actually changed hands, weighted by size. It’s not a clever transform of price — it’s a direct, honest summary of the market’s own activity. And, like everything in this series, the formula is disarmingly simple: a running sum of price times volume, divided by a running sum of volume. The institutions didn’t have secret math; they just had the discipline to measure. You can build the exact same line yourself, which is what we do in the implementation posts.
This post is educational, not financial advice. Indicators describe the past; they don’t predict the future. Backtest anything before you risk real money on it.
Sources and further reading
- The Total Cost of Transactions on the NYSE (The Journal of Finance)