Larry Williams gave this indicator a bold name for a specific reason: he was trying to fix a real flaw that plagues most momentum oscillators. Single-timeframe oscillators love to throw premature divergence signals — they surge early in a move, then “diverge” while price keeps going. The Ultimate Oscillator blends three timeframes to calm that down. Let’s do the math.
The one-sentence job
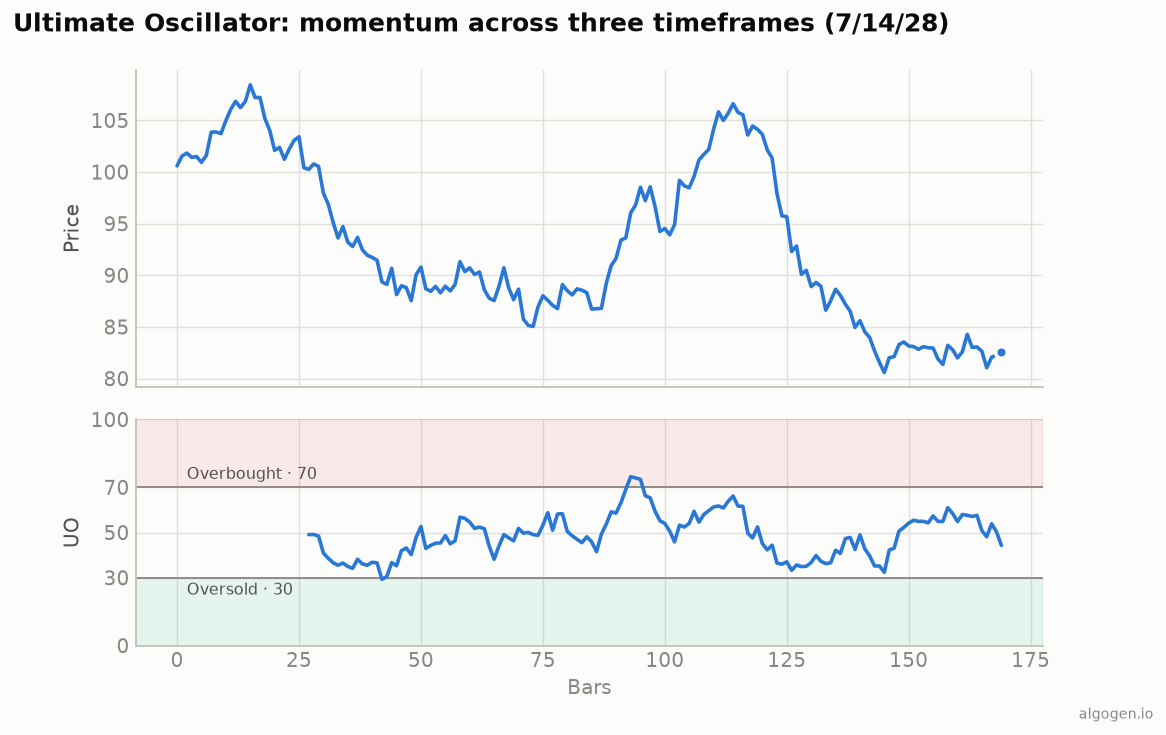
The Ultimate Oscillator measures buying pressure relative to true range across three timeframes — 7, 14, and 28 bars — and blends them into one 0–100 line, weighting the shortest most heavily. The multi-timeframe blend aims for cleaner, less premature signals than a single-period oscillator.
The formula
It’s built from two per-bar quantities, then blended. Start with:
Buying Pressure (BP) = Close − min(Low, Prior Close)
True Range (TR)      = max(High, Prior Close) − min(Low, Prior Close)
BP measures how far price closed above the session’s true low; TR is the bar’s full true range (the same ATR true range). Then compute the ratio of summed BP to summed TR over each timeframe, and blend with weights 4, 2, 1:
Avg7  = Sum(BP,7)  / Sum(TR,7)
Avg14 = Sum(BP,14) / Sum(TR,14)
Avg28 = Sum(BP,28) / Sum(TR,28)

UO = 100 × (4 × Avg7 + 2 × Avg14 + Avg28) / (4 + 2 + 1)
The weights (4/2/1) give the fast 7-bar view the most say and the slow 28-bar view the least, but all three contribute — so a signal has to hold up across horizons, not just the twitchy short one. The result is bounded 0–100, like the chart above.
How to read it
Overbought / oversold. Above 70 is overbought, below 30 oversold — the usual bounded-oscillator levels.
Williams’ divergence signal. This is what the Ultimate Oscillator was designed for, and Williams specified it precisely. A textbook buy setup: price makes a lower low but the UO makes a higher low (bullish divergence), the UO’s divergence low was below 30, and then the UO breaks above the high of that divergence. The sell is the mirror. It’s a stricter, more complete signal than “just fade the extreme.”
Centerline. Above/below 50 gives a rough momentum bias.
The settings
7, 14, 28 with weights 4, 2, 1 are Williams’ defaults and are rarely changed — they’re part of the indicator’s identity (note the periods roughly double each step). The 70/30 levels are the standard thresholds.
Where it lies to you
- Still an oscillator. Multi-timeframe blending reduces premature divergence but doesn’t abolish it — in a strong trend the UO can stay overbought/oversold for a while.
- The full signal is finicky. Williams’ complete divergence rule has several conditions; traders who shortcut it to “UO crossed 30” lose much of its edge.
- Lag from the 28-bar leg. The slow component adds delay; the UO is smoother but not fast.
The Ultimate Oscillator is a thoughtful attempt to build a better momentum oscillator by refusing to trust any single timeframe. Used with Williams’ full divergence rule, it’s more disciplined than most; used as a lazy 70/30 buzzer, it’s just a slower RSI.
Now go test it, don’t trust it
Does the full three-condition divergence signal actually beat a plain RSI cross on your market? That’s a backtest worth running. Build it in AlgoGen. Then build the UO yourself in Python, MQL5, Pine Script, EasyLanguage, or NinjaScript.
This post is educational, not financial advice. Indicators describe the past; they don’t predict the future. Backtest anything before you risk real money on it.