The Accumulation/Distribution Line is Marc Chaikin’s answer to a weakness in On-Balance Volume. OBV adds a bar’s whole volume based only on the up/down close; the A/D Line instead weights that volume by where in the bar’s range price closed. It’s a smarter cumulative volume line — and the parent of Chaikin Money Flow. Let’s do the math.
The one-sentence job
The A/D Line is a running cumulative total of volume, signed and scaled by where each bar closed within its high-low range. Rising A/D means net accumulation (buying); falling means net distribution (selling).
The formula
Two steps, then accumulate:
Money Flow Multiplier (MFM) = ((Close − Low) − (High − Close)) / (High − Low)
Money Flow Volume (MFV)     = MFM × Volume
A/D Line = running cumulative sum of MFV
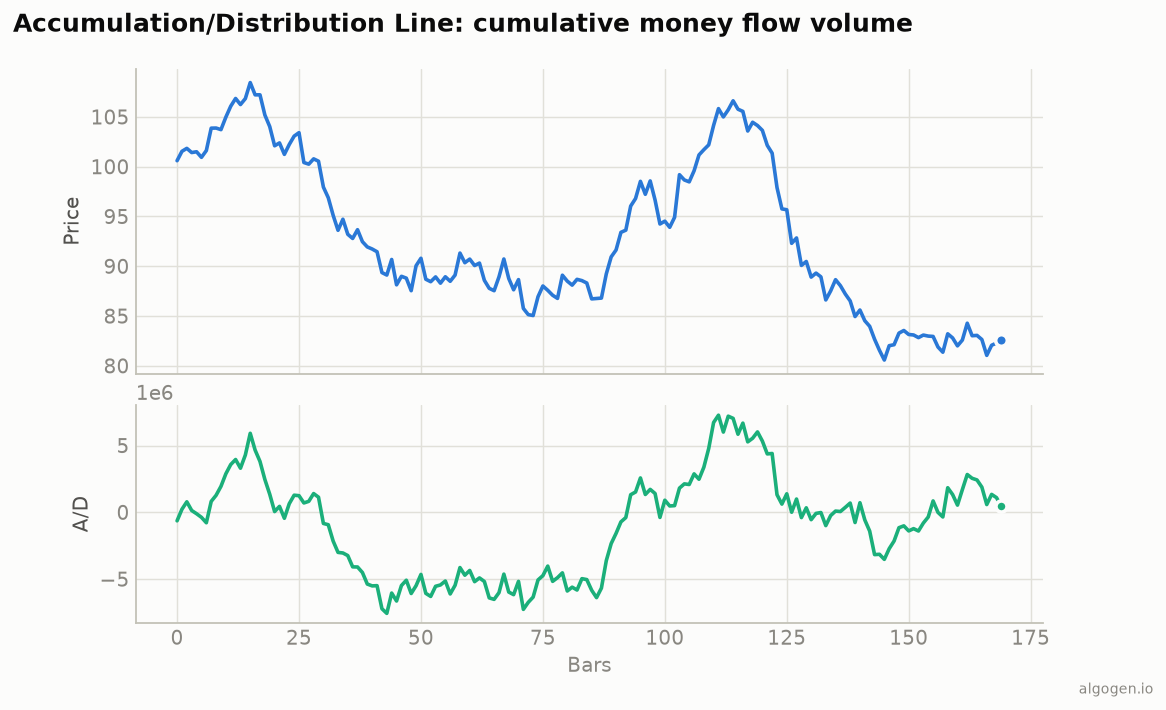
The money flow multiplier is the close-location value: +1 when the bar closes at its high, −1 at its low, 0 in the middle. Multiply by volume and you get a signed measure of that bar’s accumulation or distribution; add it to a running total and you get the A/D Line — the cumulative aqua line in the chart above.
Notice the difference from OBV: OBV adds ±(whole volume)
based only on the close direction, while the A/D Line adds MFM × volume, so a bar
that closes mid-range contributes little even on huge volume. That nuance is the whole
point.
How to read it
Confirmation. In a healthy uptrend the A/D Line should rise with price; in a downtrend it should fall with price. Agreement means volume supports the move.
Divergence. This is the A/D Line’s headline use. Price making new highs while the A/D Line rolls over (or fails to confirm) warns that buying pressure is drying up beneath the surface — potential distribution before price reflects it. The bullish mirror is A/D rising while price stalls or falls.
Trend of the line. Because it’s cumulative and unbounded, you read the A/D Line’s direction and slope and its divergences from price — never an absolute level.
A/D Line vs OBV vs CMF
The volume-flow family, distinguished:
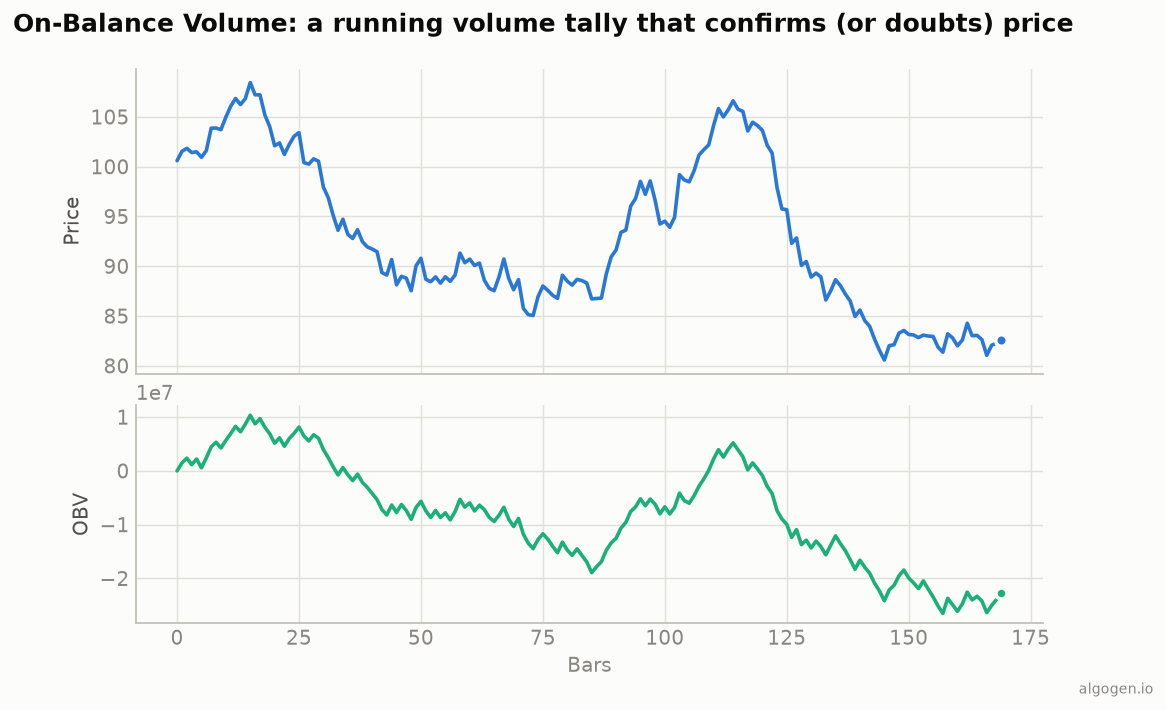
- OBV — cumulative, but binary (whole volume on any up-close). Ignores where price closed in the bar.
- A/D Line — cumulative, and weighted by close location. More nuanced than OBV.
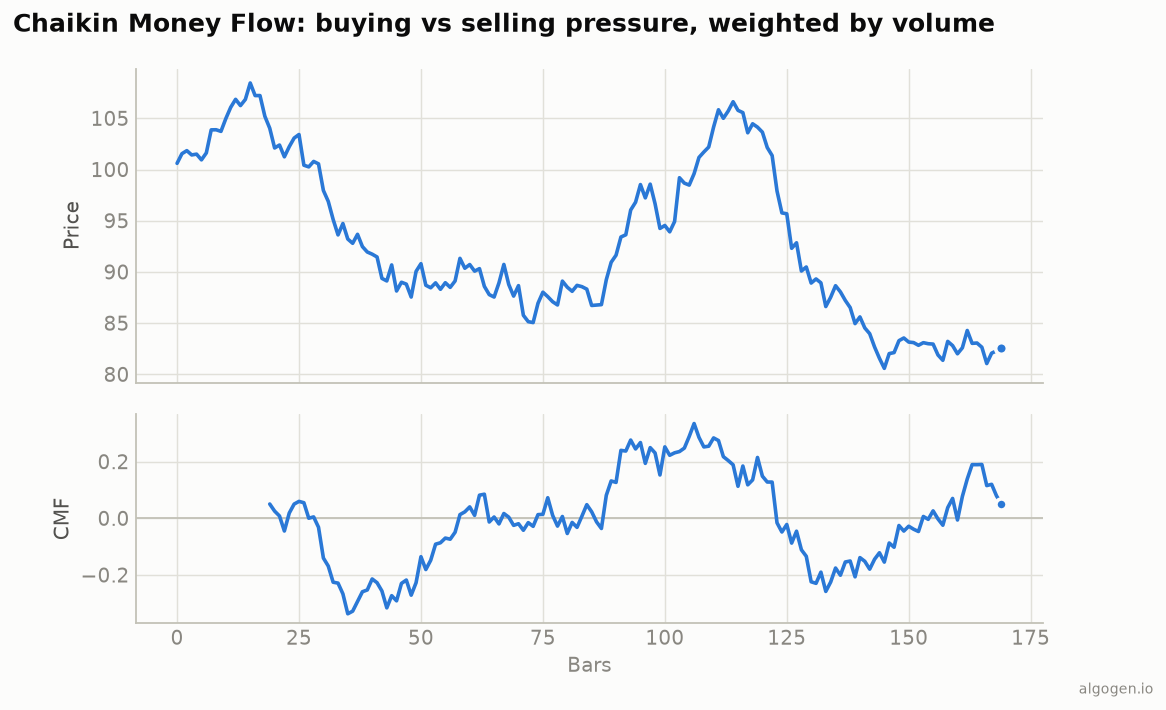
- CMF — the same money flow volume, but summed over a window and normalized, so it’s a bounded oscillator instead of a running total.
So: A/D Line is “OBV done more carefully,” and CMF is “the A/D idea made bounded.”
Where it lies to you
- It ignores gaps. The multiplier only looks inside each bar’s range, so an overnight gap — real pressure — is invisible. A bar can gap up hugely, close mid-range, and barely move the A/D Line.
- Absolute level is meaningless. Like OBV, it’s a running total from an arbitrary start; only slope and divergence matter.
- Divergence isn’t a timer. A/D can diverge from price for a long time before (or without) a reversal.
The A/D Line is a genuinely better cumulative volume gauge than OBV, and reading its divergences against price is a time-tested way to sanity-check a trend. Just respect the gap blindness and treat it as confirmation, not prophecy.
Now go test it, don’t trust it
Does A/D divergence actually precede reversals on your market? Build a divergence filter in AlgoGen and measure it. Then build the A/D Line yourself in Python, MQL5, Pine Script, EasyLanguage, or NinjaScript.
This post is educational, not financial advice. Indicators describe the past; they don’t predict the future. Backtest anything before you risk real money on it.