Most momentum oscillators have a noise problem: they twitch on every little wiggle and hand you false signals in choppy markets. TRIX was built specifically to shut that noise up, by smoothing the price not once but three times before measuring momentum. The name literally means TRiple EXponential. Let’s do the math.
The one-sentence job
TRIX is the one-bar percentage rate of change of a triple-smoothed exponential moving average of price. Because the price is smoothed three times first, TRIX ignores short-term noise and only responds to more meaningful momentum shifts.
The formula
With a common period of 15 and a signal of 9:
EMA1 = EMA(close, 15)
EMA2 = EMA(EMA1, 15)          # smooth the smoothed
EMA3 = EMA(EMA2, 15)          # smooth it again — triple exponential
TRIX = 100 × (EMA3 − EMA3 one bar ago) / EMA3 one bar ago
Signal = EMA(TRIX, 9)
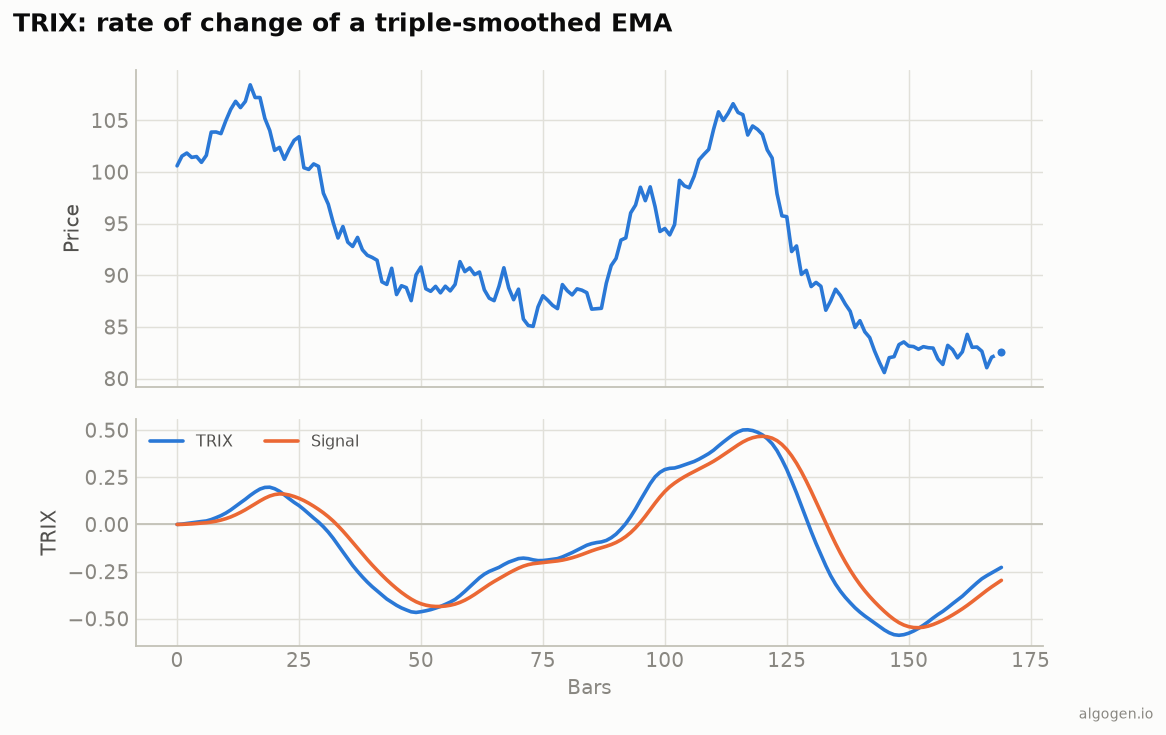
Walk it through: you take an EMA of price, then an EMA of that, then an EMA of that — three layers of exponential smoothing. Then you measure the rate of change of that ultra-smooth line from one bar to the next. The result oscillates around a zero line, and a signal line (an EMA of TRIX) gives crossover triggers — exactly like the MACD, but on a far smoother base.
Why triple smoothing?
Each EMA pass filters out shorter-term fluctuations. By the third pass, cycles shorter than the period have been almost entirely scrubbed away, leaving only the dominant momentum. The trade-off is honest and obvious: more smoothing = less noise but more lag. TRIX deliberately sits at the “smooth and slow” end of the oscillator spectrum. On the chart above, notice how clean and rounded the TRIX line is compared to a raw momentum reading.
How to read it
Zero-line cross. TRIX crossing above zero means the triple-smoothed trend is turning up (momentum positive); below zero, turning down. The main trend signal.
Signal-line cross. TRIX crossing its own signal line is the faster trigger — the same mechanic as MACD’s line/signal cross.
Divergence. Because TRIX is so smooth, its divergences from price are considered relatively clean and meaningful — price making a new high while TRIX makes a lower high is a tidy momentum warning.
Slope. The direction of the TRIX line itself (rising or falling) is a low-noise read on whether momentum is building or fading.
The settings
15 for the EMAs and 9 for the signal are common; 14 is also widely used. Shorter periods make TRIX more responsive (and noisier); longer ones smooth further. As always, treat these as starting points and test.
Where it lies to you
- It lags — a lot. Three EMAs plus a rate-of-change step stack up serious delay. TRIX confirms trends late; it will never call a top or bottom early.
- It misses fast moves. The very smoothing that kills noise also kills responsiveness. In a sharp, brief move, TRIX may barely react before it’s over.
- Zero line whipsaw is rare but real. In a genuine, prolonged range even TRIX will drift back and forth across zero, just less often than twitchier oscillators.
TRIX is the tool for traders who’d rather miss a few moves than get faked out constantly. It’s a smooth, low-noise momentum read with a clean signal line — best used on trending markets and higher timeframes where its lag matters least.
Now go test it, don’t trust it
Does TRIX’s smoothness actually translate into fewer bad trades on your market versus a faster oscillator? That’s a backtest. Compare them in AlgoGen. Then build TRIX yourself in Python, MQL5, Pine Script, EasyLanguage, or NinjaScript.
This post is educational, not financial advice. Indicators describe the past; they don’t predict the future. Backtest anything before you risk real money on it.