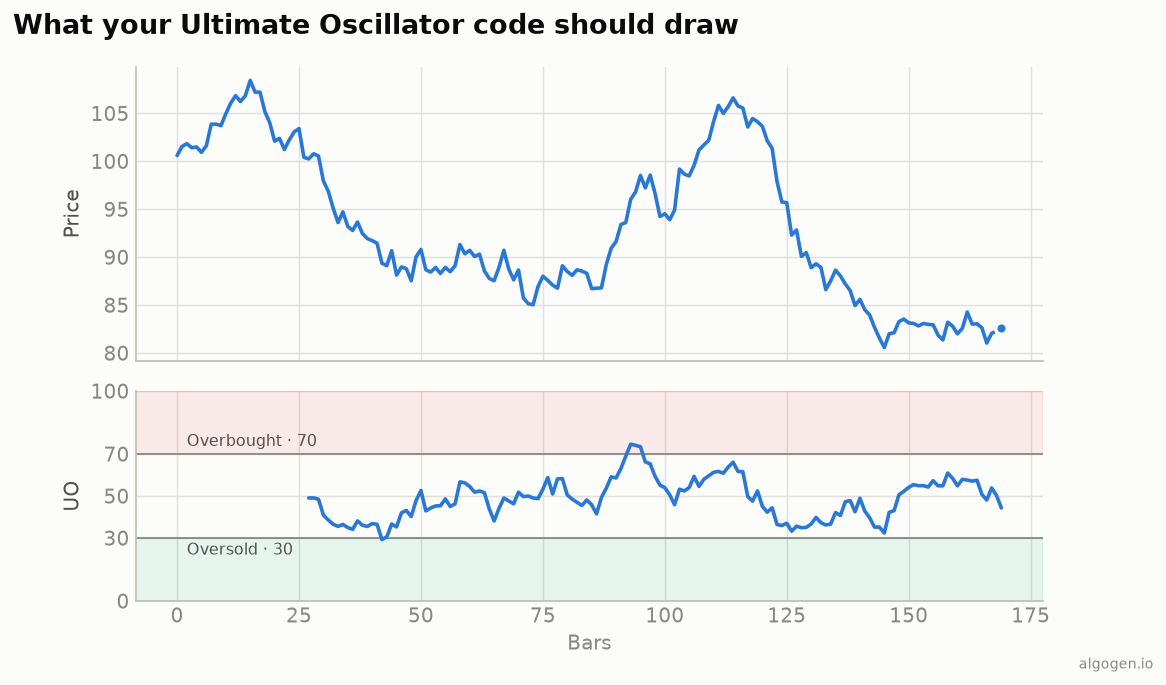
The Ultimate Oscillator in EasyLanguage is buying pressure and true range summed over
three windows with Summation, then blended. See
the explainer.
What you’ll need
- TradeStation or MultiCharts
- The EasyLanguage / PowerLanguage Editor, new Indicator
The source
{ AlgoGen Ultimate Oscillator — TradeStation / MultiCharts }
inputs:
    Len1( 7 ), Len2( 14 ), Len3( 28 );

variables:
    TrueLow( 0 ), BP( 0 ), TR( 0 ),
    A1( 0 ), A2( 0 ), A3( 0 ), UO( 0 );

TrueLow = MinList( Low, Close[1] );
BP = Close - TrueLow;
TR = MaxList( High, Close[1] ) - TrueLow;

A1 = Summation( BP, Len1 ) / Summation( TR, Len1 );
A2 = Summation( BP, Len2 ) / Summation( TR, Len2 );
A3 = Summation( BP, Len3 ) / Summation( TR, Len3 );

UO = 100 * ( 4 * A1 + 2 * A2 + A3 ) / 7;

Plot1( UO, "UO" );
Plot2( 70, "OB" );
Plot3( 30, "OS" );
MinList( Low, Close[1] ) and MaxList( High, Close[1] ) give the true-range
endpoints; Summation sums BP and TR over each window; and the 4/2/1 blend produces
the 0–100 line from the output chart.
Williams’ divergence signal
The Ultimate Oscillator’s designed use is a divergence-from-an-extreme setup, not a plain 30-cross. A simplified bullish version:
{ Add to the study above }
if Lowest( UO, 20 ) < 30 and UO crosses over 30 then
    Alert( "UO bullish setup — leaving oversold after a low" );
if Highest( UO, 20 ) > 70 and UO crosses under 70 then
    Alert( "UO bearish setup — leaving overbought after a high" );
Williams’ full rule adds a divergence-versus-price condition and a breakout past the divergence’s swing; even this simplified form is more disciplined than fading every extreme.
Gotchas
- True low/high use the prior close.
Close[1]in the min/max is what makes it true range rather than plain high-low. Summation, then divide. Sum BP and TR separately per window before dividing.- The weights.
4/2/1divided by 7 is the definition; the fastest timeframe gets the most weight.
Same indicator elsewhere: Python, MQL5, Pine Script, NinjaScript. Then backtest it in AlgoGen.
This post is educational, not financial advice. Indicators describe the past; they don’t predict the future. Backtest anything before you risk real money on it.
Sources and further reading
- What is EasyLanguage? (TradeStation)