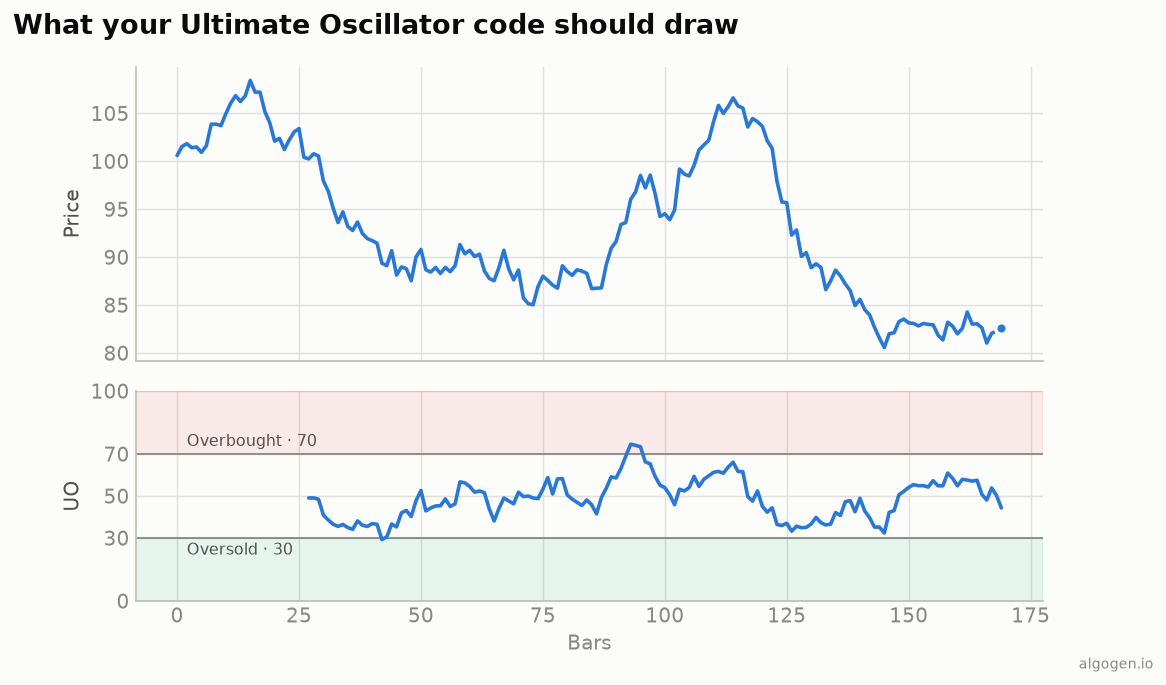
Pine has ta.uo for the Ultimate Oscillator, so the canonical version is one line —
and the from-scratch build shows the buying-pressure machinery. See
the explainer.
What you’ll need
- A TradingView account (free tier is fine)
- The Pine Editor
The source
//@version=5
indicator("AlgoGen Ultimate Oscillator", shorttitle="AG UO", overlay=false)

uoVal = ta.uo(7, 14, 28)

plot(uoVal, "UO", color=#2a78d6, linewidth=2)
h70 = hline(70, "Overbought", color=color.gray)
h30 = hline(30, "Oversold",   color=color.gray)
fill(h70, hline(100), color=color.new(#e34948, 90))
fill(hline(0), h30,   color=color.new(#1baf7a, 90))
ta.uo(7, 14, 28) returns the standard Ultimate Oscillator across the three
timeframes, bounded 0–100 with the 30/70 zones from the output chart.
From scratch
//@version=5
indicator("AlgoGen UO (manual)", overlay=false)
trueLow = math.min(low, close[1])
bp = close - trueLow
tr = math.max(high, close[1]) - trueLow
avg(len) => math.sum(bp, len) / math.sum(tr, len)
uoManual = 100 * (4 * avg(7) + 2 * avg(14) + avg(28)) / 7
plot(uoManual, color=#2a78d6, linewidth=2)
math.sum(bp, len) / math.sum(tr, len) is the summed-ratio per timeframe; the 4/2/1
blend follows. This reproduces ta.uo.
Williams’ divergence signal
The Ultimate Oscillator was built for a specific signal, not just 30/70 crosses. Here’s a practical sketch of the bullish version — oversold, then a higher UO low, then a breakout:
uoVal = ta.uo(7, 14, 28)
wasOversold = ta.lowest(uoVal, 20) < 30
higherLow   = uoVal > ta.valuewhen(ta.pivotlow(uoVal, 3, 3), uoVal[3], 0)
buySignal   = wasOversold and ta.crossover(uoVal, 30)
plotshape(buySignal, "UO buy", shape.triangleup, location.bottom, color=#0ca30c, size=size.small)
alertcondition(buySignal, "UO buy", "Ultimate Oscillator bullish setup")
It’s a simplification of Williams’ full three-condition rule, but it captures the spirit — require the extreme and the divergence and a confirming move, rather than blindly fading 30.
Gotchas
- True low/high from the prior close.
math.min(low, close[1])andmath.max(high, close[1])— the same true-range endpoints as ATR. math.sum, then divide. Sum BP and TR over each window separately before dividing; don’t average per-bar ratios.- Divergence rule.
ta.uojust gives the line; Williams’ full buy/sell rule (a divergence from an extreme plus a breakout) you’d code on top.
Same indicator elsewhere: Python, MQL5, EasyLanguage, NinjaScript. Then test a UO rule in AlgoGen.
This post is educational, not financial advice. Indicators describe the past; they don’t predict the future. Backtest anything before you risk real money on it.
Sources and further reading
- Pine Script built-ins (TradingView)