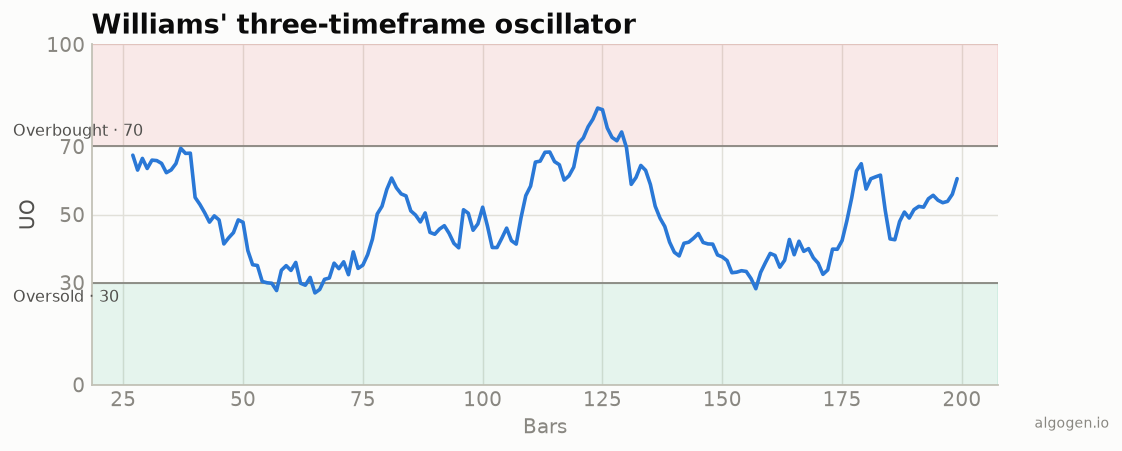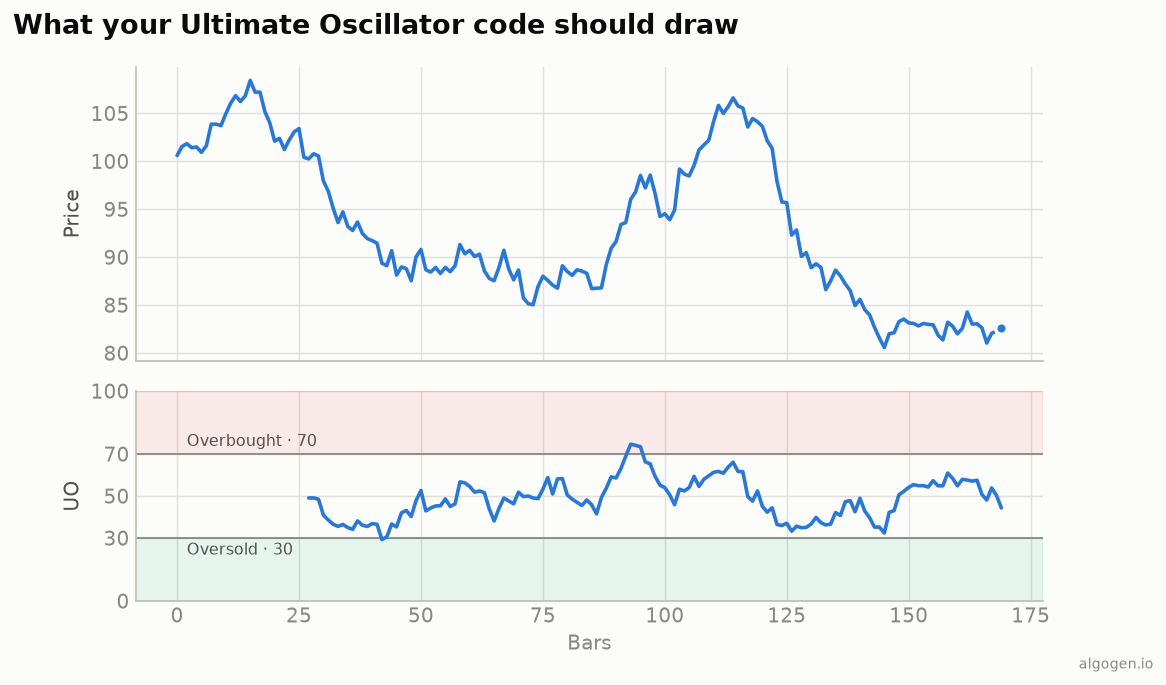
The Ultimate Oscillator has more moving parts than most, but each is simple: buying pressure, true range, three summed ratios, and a weighted blend, as the explainer covered. Here it is in pandas.
What you’ll need
- Python 3.9+,
pandas/numpy high,low,closeseries.
From scratch
import numpy as np
import pandas as pd


def ultimate_oscillator(high, low, close, s1=7, s2=14, s3=28):
    prior_close = close.shift(1)
    low_or_pc = pd.concat([low, prior_close], axis=1).min(axis=1)

    bp = close - low_or_pc                                       # buying pressure
    tr = pd.concat([high, prior_close], axis=1).max(axis=1) - low_or_pc

    avg1 = bp.rolling(s1).sum() / tr.rolling(s1).sum()
    avg2 = bp.rolling(s2).sum() / tr.rolling(s2).sum()
    avg3 = bp.rolling(s3).sum() / tr.rolling(s3).sum()

    return (100 * (4 * avg1 + 2 * avg2 + avg3) / 7).rename("uo")
bp is how far the close finished above the true low; tr is the true range; the
three ratios are summed-BP over summed-TR at each horizon; and the 4/2/1 weighting
blends them into the 0–100 line from the output chart.
Williams’ divergence signal (the real one)
uo = ultimate_oscillator(df["high"], df["low"], df["close"])
# Bullish: price lower low, UO higher low from below 30, then UO breaks the div high.
# (Sketch — a full implementation tracks the two swing points.)
oversold_div = (df["close"] < df["close"].shift(10)) & (uo > uo.shift(10)) & (uo.shift(10) < 30)
The complete rule tracks the divergence’s swing high and requires a breakout past it; even this sketch is a better filter than a plain 30-cross to test in AlgoGen.
Gotchas
- Sum, then divide. Each average is
sum(BP)/sum(TR)over the window — not the mean of per-bar ratios. - True low uses the prior close.
min(low, prior_close)andmax(high, prior_close)are the same true-range endpoints as ATR. - The weights matter. 4/2/1 (divided by 7) is the definition; changing them makes a different indicator.
A note on the full signal
Williams’ complete rule is worth stating in full, because shortcutting it loses the edge. A valid buy needs three things: (1) a bullish divergence — price makes a lower low while the UO makes a higher low; (2) the UO’s low during that divergence was below 30; and (3) the UO then rises above the high it made between the two divergence lows. The sell is the mirror (bearish divergence with a peak above 70, then a break below the intervening low). Coding it properly means tracking the two swing points and the level between them — more work than a 30-cross, but that specificity is exactly what the indicator was built to provide.
The lazy one-liner
import pandas_ta as ta
df["uo"] = ta.uo(df["high"], df["low"], df["close"])   # 7/14/28 defaults
Same indicator elsewhere: MQL5, Pine Script, EasyLanguage, NinjaScript.
This post is educational, not financial advice. Indicators describe the past; they don’t predict the future. Backtest anything before you risk real money on it.
Sources and further reading
- Windowing operations (pandas documentation)