On-Balance Volume has a blunt flaw: it adds a bar’s entire volume based only on whether the close ticked up or down, ignoring where in the bar’s range price actually closed. Chaikin Money Flow fixes exactly that. It weights each bar’s volume by how close the finish was to the high or the low — a much more nuanced read on buying versus selling pressure. Let’s do the math.
The one-sentence job
CMF measures buying vs selling pressure over the last N bars by weighting each bar’s volume according to where price closed within its range, then normalizing by total volume. Positive CMF = net accumulation (buying); negative = net distribution (selling).
The formula
Three steps, with a common period of 20:
1. Money Flow Multiplier (MFM) = ((Close − Low) − (High − Close)) / (High − Low)
2. Money Flow Volume (MFV)     = MFM × Volume
3. CMF = Sum(MFV over N) / Sum(Volume over N)
The clever bit is that Money Flow Multiplier, sometimes called the close location value:
- Close at the high → MFM = +1 (all that volume counts as buying).
- Close at the low → MFM = −1 (all selling).
- Close in the middle → MFM = 0 (a wash).
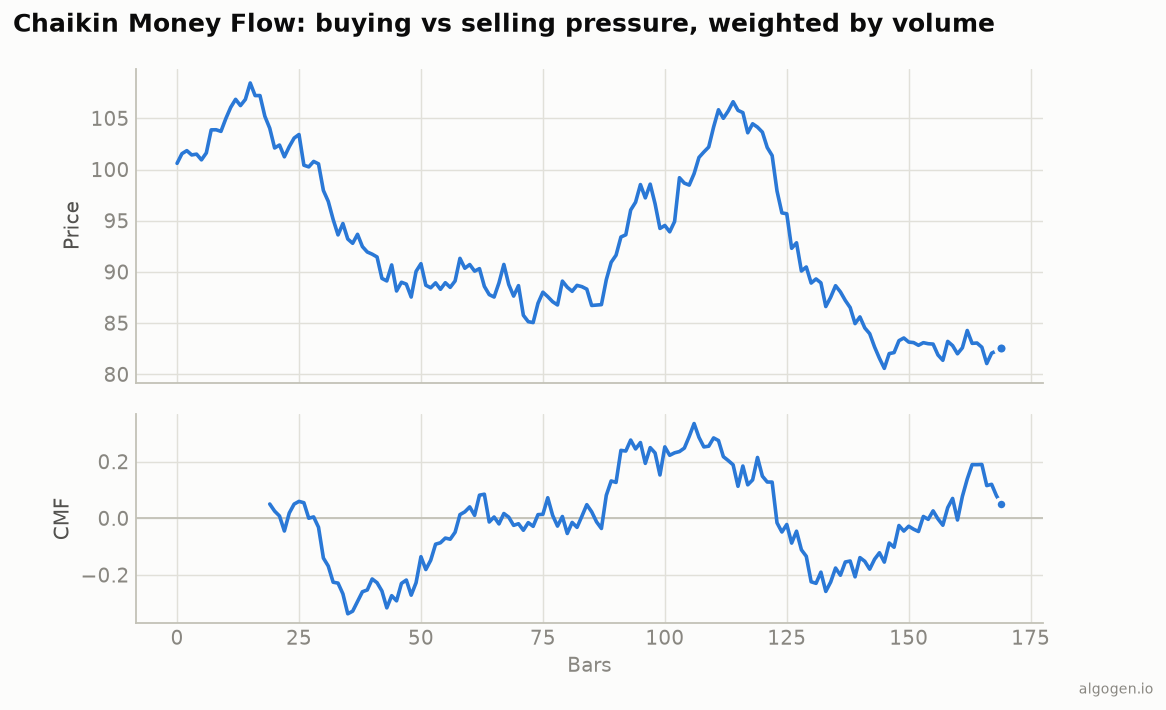
So a big-volume bar that closes near its high pumps CMF up hard, while the same volume closing mid-range barely moves it. Summing money flow volume and dividing by total volume keeps CMF bounded roughly between −1 and +1, oscillating around a zero line — as in the chart above.
How to read it
Zero line. CMF above zero means buyers dominated the window (accumulation); below zero, sellers (distribution). The zero cross is the headline signal.
Strength thresholds. Sustained readings beyond about +0.05 / −0.05 are often treated as meaningful pressure; readings hovering near zero suggest indecision.
Confirmation and divergence. Like other volume tools, CMF is most useful confirming price: rising price with positive CMF is healthy; rising price with CMF sliding below zero warns that the advance lacks buying support (bearish divergence).
CMF vs OBV vs the A/D line
These three are a family, and the distinctions matter:
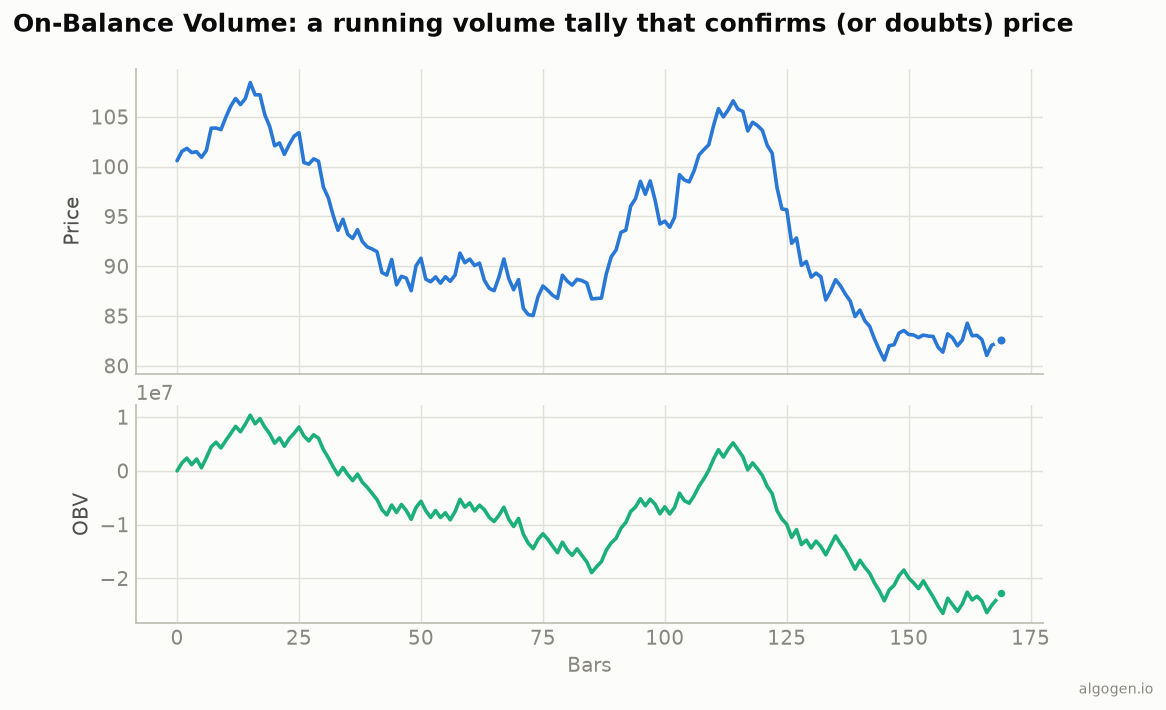
- OBV — binary (whole volume added on any up-close), cumulative, unbounded.
- Accumulation/Distribution line — uses the same money flow multiplier as CMF, but is a running cumulative total (unbounded), also by Chaikin.
- CMF — the A/D idea, but summed over a fixed window and normalized by volume, so it’s bounded and oscillates around zero. Easier to read as overbought/oversold pressure.
In short: CMF is the A/D line’s more readable, bounded cousin.
The settings
20 (or 21) is the standard lookback. Shorter windows react faster and swing more; longer ones smooth. As always, test rather than assume.
Where it lies to you
- It ignores gaps. The money flow multiplier only looks inside each bar’s high-low range, so an overnight gap — real buying or selling pressure — is invisible to it. A bar can gap up hugely yet close mid-range and register a neutral MFM.
- Thresholds are soft. The ±0.05 levels are conventions, not laws; what’s “strong” varies by instrument.
- It can fight price. CMF and price sometimes disagree for long stretches; divergence is a hint, not a timer.
- Flat bars. When high equals low (a locked or illiquid bar), the multiplier is undefined and set to zero.
Chaikin Money Flow is a genuinely better volume-pressure gauge than OBV for most purposes — bounded, volume-normalized, and sensitive to where price closes. Just remember its gap blindness and treat it as confirmation, not prophecy.
Now go test it, don’t trust it
Does CMF confirmation actually improve your entries versus price alone? Build a “only go long when CMF > 0” filter in AlgoGen and measure it. Then build CMF yourself in Python, MQL5, Pine Script, EasyLanguage, or NinjaScript.
This post is educational, not financial advice. Indicators describe the past; they don’t predict the future. Backtest anything before you risk real money on it.