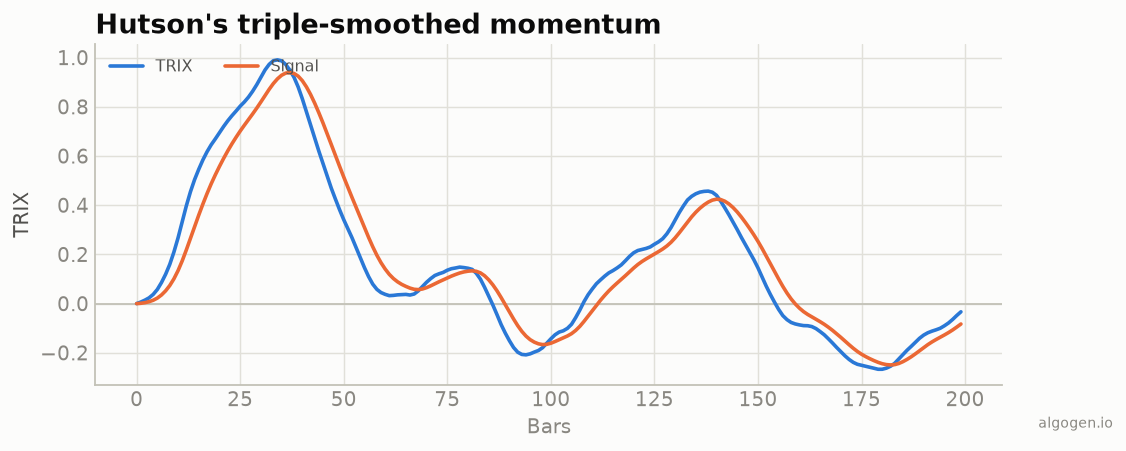
Pine makes TRIX almost trivial — three ta.ema calls, a rate of change, and a
signal line. See the explainer for the concept.
What you’ll need
- A TradingView account (free tier is fine)
- The Pine Editor
The source
//@version=5
indicator("AlgoGen TRIX", shorttitle="AG TRIX", overlay=false)

length = input.int(15, "Length")
sigLen = input.int(9,  "Signal")

ema1 = ta.ema(close, length)
ema2 = ta.ema(ema1, length)
ema3 = ta.ema(ema2, length)                 // triple exponential
trixVal = 100 * (ema3 - ema3[1]) / ema3[1]  // 1-bar rate of change
signal  = ta.ema(trixVal, sigLen)

plot(trixVal, "TRIX",   color=#2a78d6, linewidth=2)
plot(signal,  "Signal", color=#eb6834, linewidth=2)
hline(0, "Zero", color=color.gray)

alertcondition(ta.crossover(trixVal, signal),  "TRIX bull", "TRIX crossed above signal")
alertcondition(ta.crossunder(trixVal, signal), "TRIX bear", "TRIX crossed below signal")
alertcondition(ta.crossover(trixVal, 0),       "TRIX zero up", "TRIX crossed above zero")
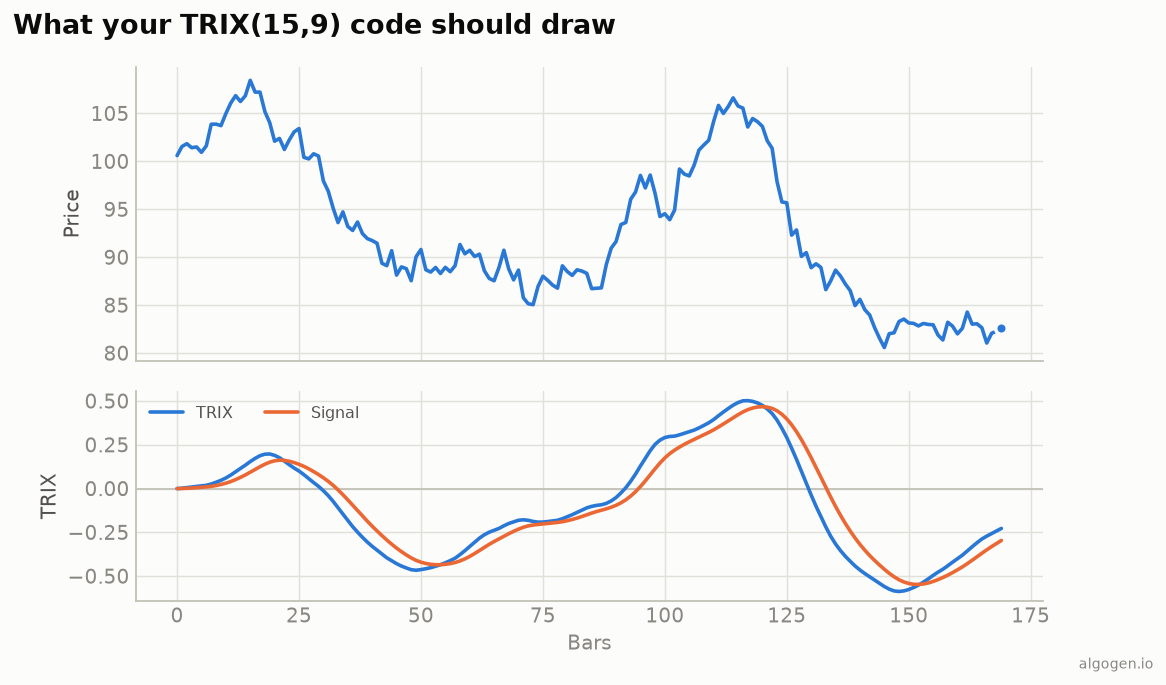
Three chained ta.ema calls give the triple smoothing; (ema3 - ema3[1]) / ema3[1]
is the one-bar rate of change; and ta.ema(trixVal, 9) is the signal — the two lines
from the output chart, with cross alerts.
Histogram and a strategy
Add a histogram (TRIX minus signal) for a MACD-style read, and wrap the cross in a
strategy to test it:
hist = trixVal - signal
plot(hist, "Hist", style=plot.style_columns,
     color = hist >= 0 ? color.new(#0ca30c, 0) : color.new(#d03b3b, 0))
//@version=5
strategy("AlgoGen TRIX System", overlay=true)
e3 = ta.ema(ta.ema(ta.ema(close, 15), 15), 15)
trixVal = 100 * (e3 - e3[1]) / e3[1]
sig = ta.ema(trixVal, 9)
if ta.crossover(trixVal, sig)
    strategy.entry("Long", strategy.long)
if ta.crossunder(trixVal, sig)
    strategy.close("Long")
The Strategy Tester will show TRIX’s character: fewer, later, cleaner signals than a fast oscillator.
Gotchas
- Chain the EMAs, don’t re-smooth price. Each
ta.ematakes the previous EMA as input (ema2 = ta.ema(ema1, ...)), notcloseagain. - ROC after the third EMA. Take the rate of change of
ema3, the final smoothing — not of an intermediate one. ta.roc(ema3, 1)would also work for the rate-of-change step; the explicit form above just makes it visible.
Same indicator elsewhere: Python, MQL5, EasyLanguage, NinjaScript. Then test a TRIX rule in AlgoGen.
This post is educational, not financial advice. Indicators describe the past; they don’t predict the future. Backtest anything before you risk real money on it.
Sources and further reading
- Pine Script built-ins (TradingView)