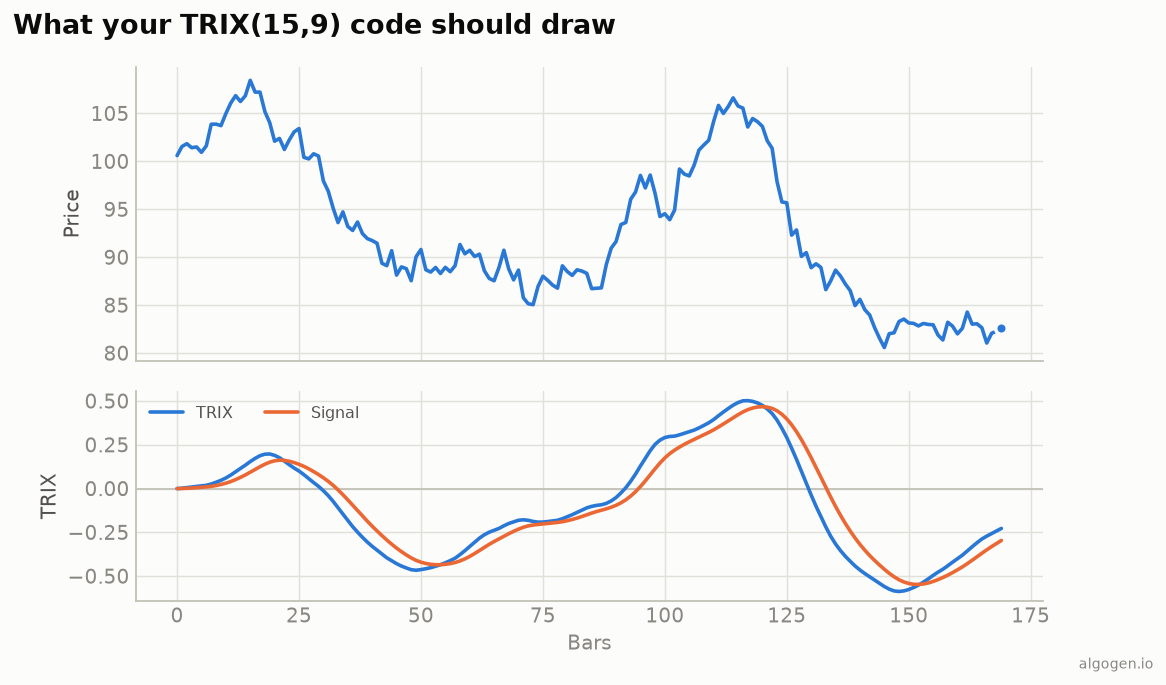
TRIX looks exotic but it’s just three EMAs stacked, then a rate of change — a few lines of pandas, as the explainer covered. Here it is, plus the signal line.
What you’ll need
- Python 3.9+,
pandas - A
closeseries.
From scratch
import pandas as pd


def trix(close, period: int = 15, signal: int = 9):
    ema1 = close.ewm(span=period, adjust=False).mean()
    ema2 = ema1.ewm(span=period, adjust=False).mean()
    ema3 = ema2.ewm(span=period, adjust=False).mean()   # triple exponential

    trix_line = 100 * ema3.pct_change()                 # 1-bar % rate of change
    signal_line = trix_line.ewm(span=signal, adjust=False).mean()
    return pd.DataFrame({"trix": trix_line, "signal": signal_line})
Three chained ewm calls do the triple smoothing; pct_change() is the one-bar
rate of change of that ultra-smooth line; and an EMA of TRIX is the signal — the two
lines from the output chart.
Signals
t = trix(df["close"])
above = t["trix"] > t["signal"]
df["trix_bull"] = above & ~above.shift(1, fill_value=False)   # crossed above signal
df["zero_bull"] = (t["trix"] > 0) & (t["trix"].shift(1) <= 0) # crossed above zero
Both are clean, low-noise signals to backtest in AlgoGen.
Gotchas
adjust=False. Use it on all three EMAs so they’re the standard recursive EMA (see the EMA post).- Smooth, then rate-of-change. The order matters: three EMAs first, then the percent change of the result — not the other way around.
- It lags. Three smoothings plus a ROC is a lot of delay by design; don’t expect TRIX to be timely, expect it to be clean.
The histogram view
Like the MACD, TRIX reads nicely as a histogram of the line minus its signal — the gap shrinks before the actual cross, giving an earlier heads-up:
t = trix(df["close"])
t["hist"] = t["trix"] - t["signal"]
# Momentum-of-momentum turning: histogram crossing zero == a TRIX/signal cross.
Plot hist as bars (green when rising, red when falling) alongside the two lines for
a MACD-style read on ultra-smoothed momentum.
The lazy one-liner
import pandas_ta as ta
df.ta.trix(length=15, signal=9, append=True)   # adds TRIX/TRIXs columns
Same indicator elsewhere: MQL5, Pine Script, EasyLanguage, NinjaScript.
This post is educational, not financial advice. Indicators describe the past; they don’t predict the future. Backtest anything before you risk real money on it.
Sources and further reading
- Windowing operations (pandas documentation)